





Best Banking Stocks in India 2026
October 26, 2026



TABLE OF CONTENTS
Get AI Summary





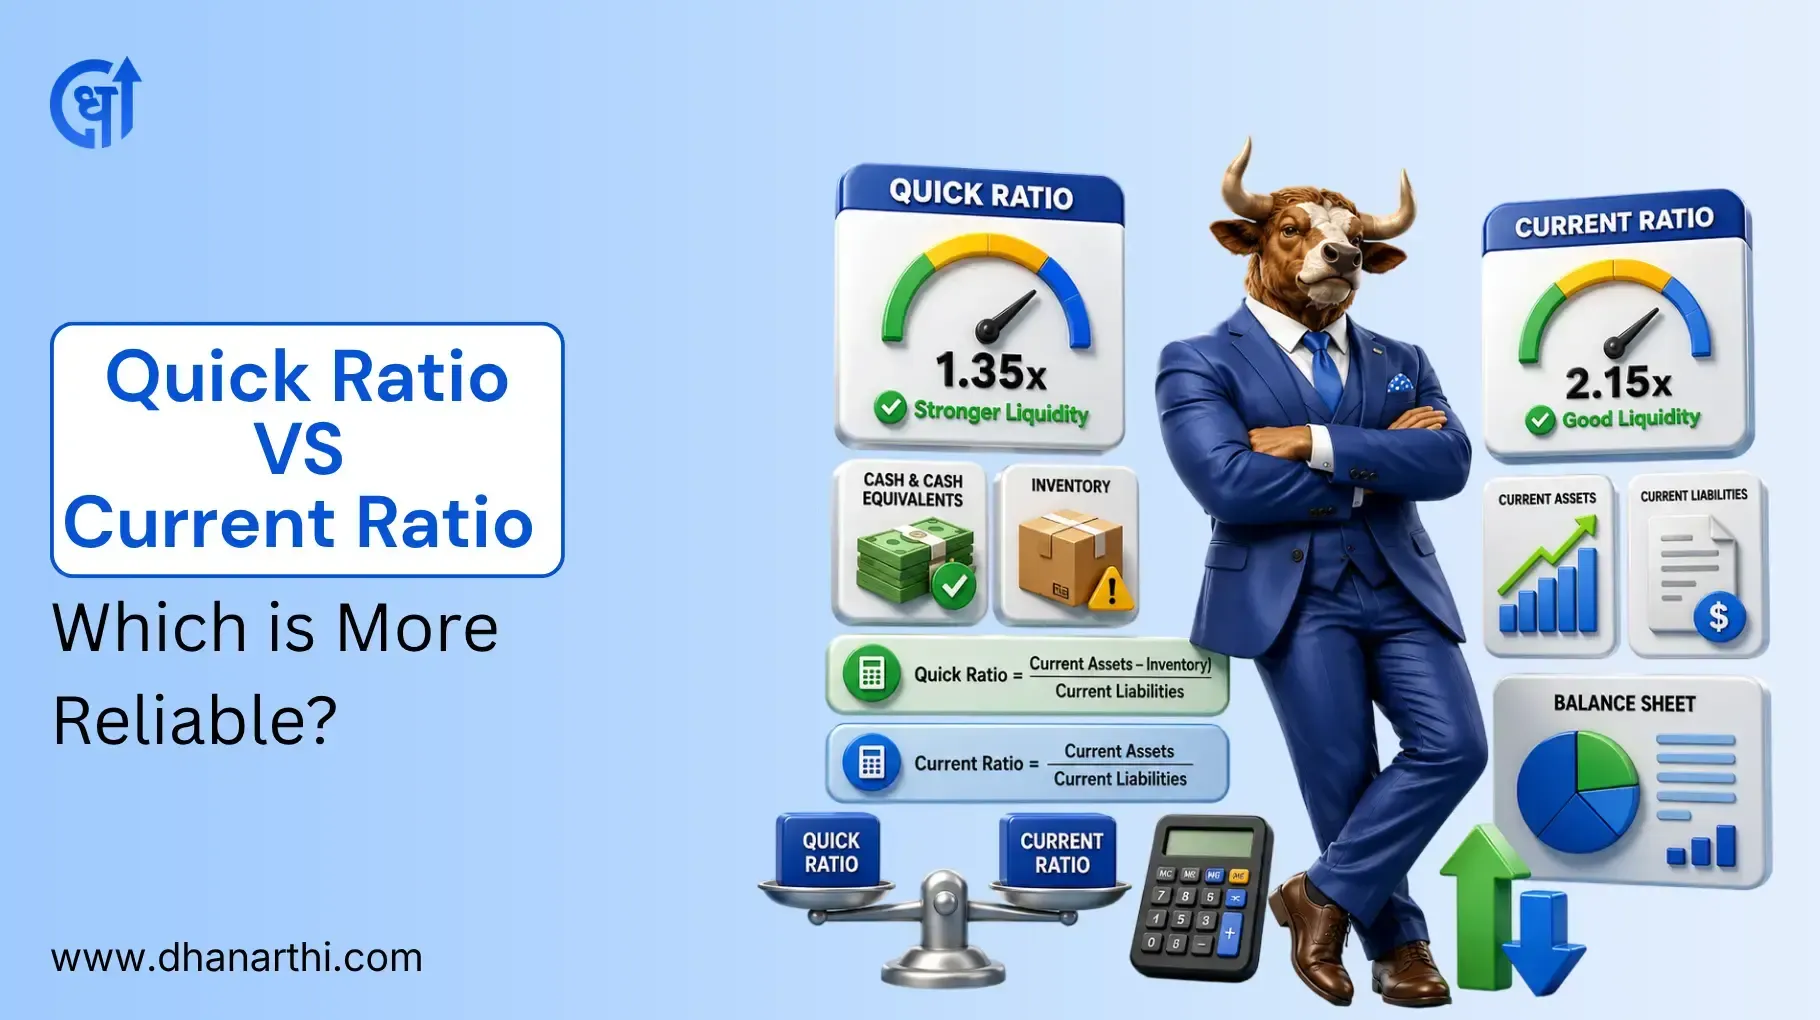
The main difference between the Quick Ratio and the Current Ratio lies in their definitions. The current ratio is calculated by dividing the current assets by the current liabilities, which include the inventory.
The quick ratio is the same as the current ratio, except that it does not include the inventory and the prepaid expenses in the numerator, making it a slightly more strict indicator of the ability of the company to pay its short-term liabilities.
Current Ratio = Current Assets ÷ Current Liabilities
Quick Ratio = (Current Assets minus Inventory minus Prepaid Expenses) ÷ Current Liabilities
The ideal current ratio is generally considered around 2:1, while the ideal quick ratio is closer to 1:1
Quick ratio is more reliable for inventory-heavy businesses, since it strips out stock that may not convert to cash quickly
Both ratios should be read together, not in isolation, to judge true liquidity
For the full mechanics of current ratio on its own, read current ratio explained
The current ratio meaning in simple words is the number of rupees of short-term assets for every rupee of short-term liabilities that the firm owes. This is simply the broad liquidity test that is arrived at from the balance sheet of the company.
Current Ratio = Current Assets / Current Liabilities
Current assets are cash, accounts receivable, inventory, and other assets that are expected to be converted into cash within one year. On the other hand, current liabilities are accounts payable, short-term borrowings, and other debts that are due within one year.
The current ratio calculation principle is simple, but analysis may be tricky.
A current ratio above 1 indicates a company has enough assets to pay off its short-term debt, meaning it is in a good position. A current ratio below 1 suggests that the company may have trouble meeting its liabilities without raising additional equity. At the same time, a ratio significantly higher than 1 (typically 3:1 or 4:1) means the firm keeps too much cash and inventory instead of investing in productive assets.
Current ratio analysis typically aims at 2:1, but it depends on the industry.
The quick ratio, also known as the acid-test ratio, helps determine a firm’s ability to pay its short-term debts by using only those current assets that can be quickly converted into cash. Unlike the current ratio, the acid-test ratio excludes inventory and prepaid expenses from the list of current assets.
Quick Ratio = (Current Assets − Inventory − Prepaid Expenses) / Current Liabilities
Therefore, the quick ratio is a more conservative indicator of a firm’s liquidity. It enables to analyze if the firm can pay its short-term obligations even if it cannot sell its inventory within a reasonable period.
A simplified formula for the quick ratio can be made by focusing on the most liquid asset classes, as it excludes inventory and prepaid expenses:
QR = (Cash & Cash Equivalents + Marketable Securities + Accounts Receivable) / Current Liabilities
Titan Company had current assets of Rs 30,400 crore and current liabilities of Rs 21,600 crore as of FY2025, resulting in a current ratio of 1.4x, compared to 1.5x in FY2024 (Source: Equitymaster annual report analysis, FY2025).
| Metric | FY2025 Figure |
|---|---|
| Current Assets | Rs 30,400 crore |
| Current Liabilities | Rs 21,600 crore |
| Current Ratio | 1.4x |
Data sourced from the company's FY2025 annual report figures via Equitymaster. Last updated: June 2026.
Titan has a significant amount of its current assets in gold and jewellery inventory, which is typical for the industry, but this implies that its quick ratio would be significantly lower than its current ratio.
This is because the current ratio of jewellery and retail firms with substantial inventory is often misleadingly high.
The optimal level of the current ratio is 2:1, which implies that there should be Rs 2 of current assets for every Rs 1 of current liabilities. However, in reality, it differs from industry to industry.
| Current Ratio Range | Interpretation |
|---|---|
| Below 1.0 | Potential liquidity ris;, current liabilities exceed current assets |
| 1.0 to 1.5 | Acceptable for asset-light or fast-inventory-turnover sectors like retail |
| 1.5 to 2.0 | Generally considered healthy for most non-financial businesses |
| Above 3.0 | May signal idle cash or inefficient capital use |
Retailers and FMCG companies tend to have lower current ratios, sometimes as low as below 2.0, because of their ability to quickly convert inventory to cash. Meanwhile, manufacturers and heavy industries require higher current ratios because of the long production cycles.
Neither ratio is universally more reliable. Each answers a different question about liquidity.
| Factor | Current Ratio | Quick Ratio |
|---|---|---|
| Includes inventory | Yes | No |
| Best for | General liquidity overview, retail and fast-turnover sectors | Inventory-heavy or slow-turnover sectors like manufacturing |
| Strictness | More relaxed | More conservative |
| Risk of overstating liquidity | Higher, since stuck inventory still counts | Lower |
I think that when a company has high, slow-moving inventory, the quick ratio is a better assessment of its liquidity than the current ratio. However, when it comes to a company that has a quick turnover of its inventory, the current ratio is a better metric to use.
A significantly different result of the current and quick ratios is also a concern. If a firm has a current ratio of 2.0 and a quick ratio of 0.5, it indicates that almost all the current assets are held in the form of inventory.
It is normal for jewellery stores, car dealers, and heavy equipment manufacturers to have a higher current ratio due to the high amount of inventory they hold. However, the sharp decline from one period to another is alarming and implies a decrease in sales and slow inventory turnover.
Both ratios, on the other hand, provide only a snapshot of the situation. Another issue with liquidity ratios is that they do not consider the timing of cash receipts and payments within a period. As a result, a firm may pass both tests but experience cash shortages in a particular month.
In addition, both ratios may be positively influenced by unusual events, such as large payments from customers made shortly before the end of the reporting period.
The quick ratio, in particular, is based on the assumption that all receivables will be collected in time, which may not always be the case for some firms. For a more comprehensive assessment of a company’s financial position, one should look at other financial ratios and indicators.
For a detailed analysis of liquidity ratios and financial ratios in general, please refer to the financial ratio analysis article.
The current ratio provides a broad assessment of the short-term liquidity position of a company, whereas the quick ratio is a more conservative measure that excludes inventory. Thus, neither of the ratios is better than the other.
The current ratio should be used as a primary indicator of short-term liquidity. In contrast, the quick ratio should be applied when the company has large amounts of inventory, and the two ratios should be used together to identify significant changes in liquidity position.
Disclaimer: This article is for educational purposes only. It does not constitute investment advice. Please consult a SEBI-registered financial advisor before making investment decisions.
1. What is the difference between current ratio and quick ratio?
Current ratio includes all current assets, including inventory. Quick ratio excludes inventory and prepaid expenses, giving a stricter test of immediate liquidity.
2. What is current ratio?
Current ratio measures a company's ability to pay short-term liabilities using short-term assets. It is calculated as Current Assets divided by Current Liabilities.
3. What is the current ratio formula?
Current Ratio = Current Assets / Current Liabilities. For example, Rs 30,400 crore in current assets against Rs 21,600 crore in current liabilities gives a current ratio of 1.4x.
4. What is the quick ratio formula?
Quick Ratio = (Current Assets minus Inventory minus Prepaid Expenses) divided by Current Liabilities. A simplified version adds cash, marketable securities, and receivables directly.
5. The ideal current ratio is what number?
The ideal current ratio is generally cited as 2:1, though anything above 1 is usually considered acceptable, with the right benchmark varying by sector.
6. Is quick ratio more reliable than current ratio?
Quick ratio is more reliable for inventory-heavy businesses since it excludes stock that may not convert to cash quickly. Current ratio remains useful as a quick, broader first check.
7. What does it mean if current ratio is high but quick ratio is low?
It usually means a large share of current assets is tied up in inventory rather than cash or receivables, which can overstate how liquid the company really is.
8. Can current ratio and quick ratio be the same?
Only if a company has no inventory and no prepaid expenses, which is uncommon. In most businesses, the current ratio is noticeably higher than the quick ratio.
9. What is a bad quick ratio?
A quick ratio below 1 generally means the company cannot cover its short-term liabilities without relying on inventory sales, which can be a warning sign depending on the sector.
10. Should investors use current ratio or quick ratio when analysing a stock?
Both should be used together. Current ratio gives a broad liquidity view, while quick ratio confirms whether that liquidity holds up once inventory is excluded.
Share Market
IPO
Artificial Intelligence
Semi Conductor