

Revenue vs Profit: Key Differences Investors Must Know
June 19, 2026

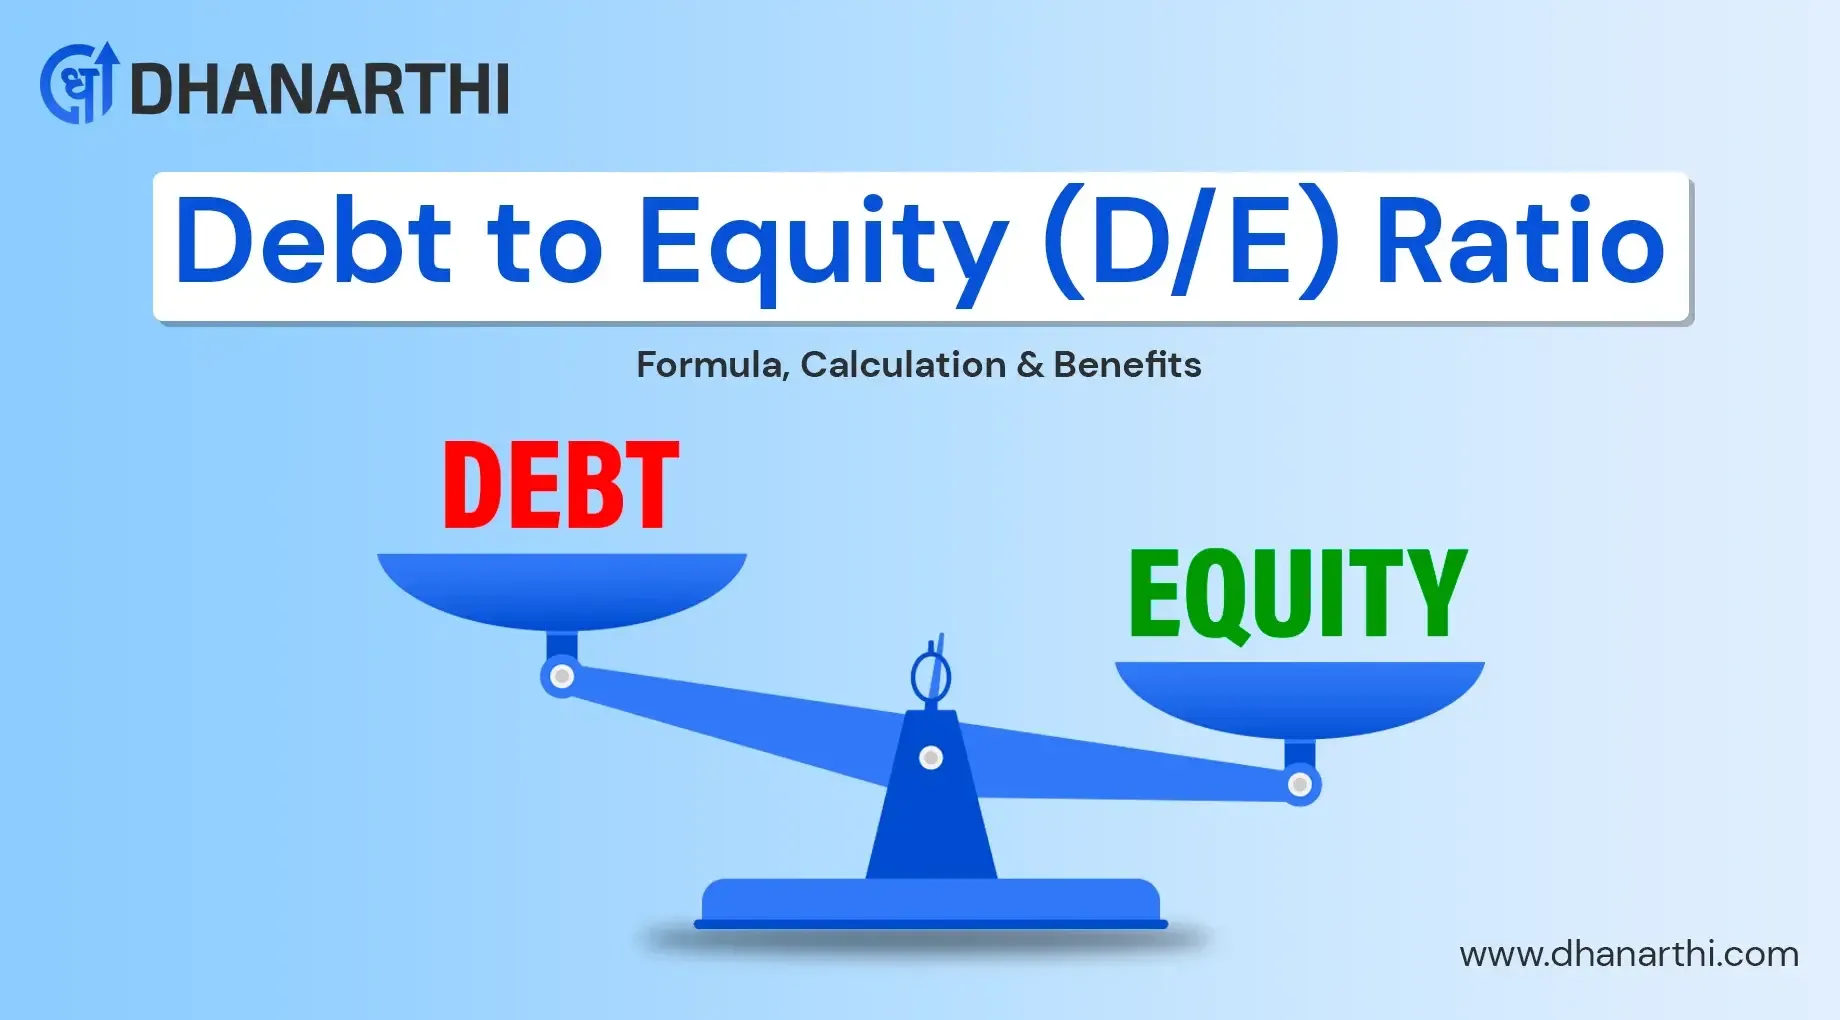
TABLE OF CONTENTS
Get an AI Summary of This Post Using The Tools Below.


At the beginning of my stock analysis, all the financial ratios around were a total confusion to me. However, the debt-to-equity ratio was the one most repeated among the ratios. It seemed difficult to understand at first, but once the concept was clear to me, the whole picture became very clear.
The debt-to-equity ratio is a measure of the company’s stability, which is crucial to be known by all potential investors to know. The ratio indicates the proportion of equity and debt that the company is using to finance its operations.
Therefore, it depends on the level of risk you are willing to take; the ratio may vary from sector to sector and even vary in the same company at different times. Today, I am going to explain the debt-to-equity ratio in the simplest way possible. This guide is for everyone, be you are a newbie in investing or one trying to figure out his/her business finances.
In the most straightforward way possible, let me present this to you. The debt-to-equity ratio (or D/E ratio) is a number that indicates the extent of debt a company is utilizing in comparison to its own funds (equity).
Suppose you are going to buy a house priced at ₹300,000. You give ₹100,000 as a down payment from your own resources and take ₹200,000 as a loan from the bank. Your D/E ratio will be 2.0 since you have taken out a loan equal to your own investment twice.
From my point of view, the concept of to debt-to-equity ratio is made much clearer if one uses such real-life examples to explain it. The companies also follow the same pattern. They blend their capital requirements with finances from lenders to the extent that they are able to operate.
When I come to the financial statements of a company, the D/E ratio first reveals the preference of the company regarding the funding of the company's operations.
There are two basic sources from which a company could derive its funds:
Debt indicates the borrowing of money from banks, selling bonds, or taking loans. The company is still obliged to make the interest payments and eventually repay the entire amount, regardless of its financial situation.
Equity means using the money of the shareholders or reinvesting the profits back into the business. The company does not have to give back the money to its shareholders, but the shareholders expect the company to grow and their investments to increase in value.
I have observed that understanding the reasons behind companies opting for debt instead of just using equity is a common problem for most people. However, the truth is that in moderation, debt can be good. It is usually less expensive than equity, and the company can deduct the interest expense from its taxable income.
The DE ratio calculation is a useful tool for investors like you and me to make a quick decision about whether a company is cautious or has gone overboard with its risk-taking.
Throughout my years of analyzing the companies, the D/E ratio has been the major determining factor of the company's survivability during periods of difficulty.

Here are the reasons this ratio has so much significance:
The ratio being that high denotes that the company is in a lot of debt already. In the case of the company experiencing a downturn in sales or revenues, the company would still be required to pay its creditors. This could lead to the worst of situations.
The first thing I do is to check this ratio before investing in any company. It indicates to me the extent of financial leverage the company is employing. If it's way above the norm for that industry, I then decide not to invest.
Lenders and banks examine this ratio before granting loans. An already high D/E ratio company will find it very hard to secure additional funding, which consequently could choke the growth.
Low-debt companies have more freedom to operate. They can hold on for longer when competition is tough and are more likely to invest their money in great ideas.
I personally use tools from platforms like Dhanarthi when I want to quickly compare D/E ratios across multiple companies. It makes the analysis much faster than calculating everything manually.
Let's dive into the formula for the debt-to-equity ratio. It might sound like a complicated task, but it i, in fact, a very easy one.
The primary formula for this calculation is:
Debt to Equity Ratio = Total Debt / Total Equity
You will have the total debt of the firm in the numerator and total equity in the denominator. The output will be your D/E ratio.
But this is the point where sometimes confusion occurs. What exactly are the "debt" items and the "equity" items?
Total Equity, which is frequently referred to as shareholders' equity, contains common stock, preferred stock, retained earnings, and other reserves as its major components. In simple terms, it is what would be left if the company sells its assets, pays off its creditors, and settles all its obligations.
I can suggest, based on my experience, that the company's balance sheet is usually the easiest source to get these figures from. The equity ratio on the balance sheet is, generally speaking, quite easy to find under the liabilities and equity sections.
Let me illustrate exactly how this ratio functions in my mind when I analyze a company. Let's make this really straightforward.

For starters, the most recent balance sheet is needed. This document can be located in the company's yearly report or quarterly documents.
Check out the estate liabilities section. It is usually divided into the following parts:
Current liabilities or short-term debt
Non-current liabilities or long-term debt
Sum these two to arrive at the total debt. Certain analysts consider interest-bearing debt only, but I prefer to include all liabilities for a more cautious estimate.
At the end of the balance sheet, it is normally referred to as "Shareholders' Equity" or "Stockholders' Equity." It is an all-inclusive figure that contains all the components of equity.
Divide the total amount of debt by the total amount of equity to obtain the value for the Debt/Equity ratio.
A 1.0 ratio indicates that the company has equal amounts of debt and equity. A 2.0 ratio indicates that the debt is twice as much as the equity. A 0.5 ratio indicates that the debt is half the amount of the equity.
After that, most people consider it simple. The essence is to be aware of the right place to check in the balance sheet.
I always believe that when real-world examples come into play, everything becomes much clearer. Let us now use some real-life examples to get you through this.
Example 1: A Technology Company
Let's specify a case of Tech Company ABC, which has:
Total Debt: ₹500 Crore
Total Equity: ₹1,000 Crore
DE ratio determination: ₹500crore/₹1,000n / ₹1,000 Crore = 0.5
This indicates that the corporation bears 50 cents of debt for every dollar of ownership. That is quite prudent and indicates that the corporation is not overly reliant on debt.
Example 2: A Manufacturing Company
The financial leverage of the Manufacturing Company XYZ is very high, as its total debt and equity are:
Total Debt: ₹3,000 Crore
Total Equity: ₹1,000 Crore
Debt to Equity Ratio: ₹3,000 Crore / ₹1,000 Crore = 3.0
This ratio indicates that the firm has debited its equity. Such an instance is considered aggressive and is indicative of a higher risk, financially.
Example 3: A Retail Company
Retail Company DEF has incurred
Total Debt: 800 Crore
Total Equity: ₹400 Crore
D/E ratio: ₹800 Crore/₹400 / ₹400 Crore = 2.0
The company under consideration has a D/E ratio of 2.0, indicating that it has ₹800 Crore of debt compared to ₹400 Crore of equity. This is a common scenario for the retail sector, but it would raise a red flag in sectors with lower debt tolerance.
Through my experience with different industries, one of my major takeaways is that context is everything. A D/E ratio that is accepted within one industry might be quite alarming in another. I always manage to compare financial statements of companies within the same industry through comprehensive financial analysis, which helps me a lot in doing analysis.
I always manage to compare financial statements of companies within the same industry, which helps me a lot in doing analysis.
Now that the calculation is mastered, let us decipher what the numbers stand for.
Ratio Below 1.0: The corporation's equity exceeds its liabilities. This is an indicator of financial management that is quite conservative and hence lower in risk. The company is not borrowing much to finance its operations.
Ratio Around 1.0 to 2.0: This indicates the ideal situation for a host of industries. The corporation is utilizing a well-rounded financing strategy consisting of both debt and equity. It is enjoying the perks of debt in terms of tax while not putting itself in a risky situation.
Ratio Above 2.0: The firm is using a lot of debt financing, which means its debt is significantly higher than its equity. While this can be risky in case of revenue fall or interest rates rise, there are still some sectors where this is a normal practice.
Ratio Above 5.0: Most industries would consider this a tarred flag. The firm is highly leveraged and could end up in a big mess if the economic environment becomes adverse.
I have seen investors often falling into the trap of thinking that lower is always better. However, that is not always the case. Some amounts of debt, if well-managed, can actually bring higher returns for shareholders. The secret is to discover the right balance for every industry and business model.
When I employ tools such as Dhanarthi's screener for filtering companies, I won't settle for the lowest D/E ratios only. Rather, I will search for firms whose ratios are justifiable for their sector and have remained stable over the years.
I would say that this question is the most frequently asked, and, to be honest, there is just no universally applicable answer.

The perfect debt equity ratio varies according to several conditions:
Industry Standards: Capital-intensive industries such as power, telecommunications, and manufacturing usually have higher ratios because they require large amounts of money to be invested in equipment and building up the infrastructure. For instance, a D/E ratio of 2.0 might seem totally normal for a utility company, but would raise eyebrows for a software company.
Company Age: Mature companies with constant cash flows can more easily bear the burden of debt than young, developing companies. A startup with a high D/E ratio is safer than a mature company with the same ratio.
Interest Rates: High debt ratios are easier to bear during periods of low interest rates. Rising rates will make already highly indebted companies incur even more costs.
Expansion: Companies experiencing rapid growth might increase their debt levels in order to finance their expansion, which could be tolerable if they are already producing hefty returns.
From my experience, here's a general guideline I use:
Below 0.5: Very conservative, possibly underleveraged
0.5 to 1.0: Conservative and generally safe
1.0 to 2.0: Moderate leverage, typical for many industries
2.0 to 3.0: Aggressive leverage requires careful examination
Above 3.0: High risk, needs strong justification
But remember, these are just guidelines. I always compare companies against their industry peers rather than using absolute standards.

I want to tell you about some industry benchmarks that I have noticed over the years. These values allow you to realistically understand what's considered normal in different industries.
| Industry | Typical D/E Range | Reason |
|---|---|---|
| Technology (Software) | 0.2-0.6 | Low capital requirements, equity-focused |
| Healthcare/Pharma | 0.3-0.8 | Stable cash flows, R&D investments |
| Utilities | 1.0-2.0 | Stable revenues support higher debt |
| Real Estate/REITs | 1.5-3.0 | Asset-backed financing, predictable income |
| Financial Services | 4.0-8.0 | Leverage is core to the business model |
| Manufacturing | 0.4-1.0 | Moderate capital needs |
Technology Sector: Companies in the tech sector usually have quite low D/E ratios, which are often in the range of 0.2 to 0.8. Little physical infrastructure is needed by them, and they can still grow their operations with a minimum of debt. Very low debt levels are characteristic of software firms.
Utility Sector: The ratios of such businesses usually range from 1.5 to 2.5 and even more. Their infrastructure investments are enormous, and in return, they have cash flows so smooth and predictable that they can afford to be in debt for even longer.
Financial Sector: The same principles do not apply to banks and financial institutions. Their ratios are often very high, sometimes exceeding 5.0, as borrowing and lending transactions comprise their essential business model. Comparing a bank's D/E ratio to other industries would be misleading.
Retail Sector: Retailers usually have D/E ratios that vary from 0.5 to 2.0, depending on their business model. Conventional retailers with brick-and-mortar stores generally have greater ratios than online retailers.
Manufacturing Sector: Depending on the capital intensity of their operations, manufacturing companies mostly have debt-equity ratios that range from 1.0 to 2.5.
Real Estate Sector: Real estate companies and REITs frequently have large ratios (2.0 to 4.0) because investments in real estate usually involve a significant amount of borrowing.
When analyzing stocks from the fundamental point of view, I first look at industry averages for any company before making my judgment. Among other things, Dhanarthi is a website that allows you to filter and compare companies within the same industry, thus making this comparison easier.
In other words, a debt-to-equity ratio that is considered "bad" is a situation where a company has so much debt that it cannot manage it safely; however, the extent of the "too high" very much depends on the context.

Here are the red flags I look for:
Significantly Above Industry Average: A company whose financial ratio is 50% or more above that of the industry is a clear indicator of taking on more financial risk than its rivals.
Rising Trend: If the number itself is not quite alarming, still, a quickly growing D/E ratio over several quarters points to the company's heavy borrowing, which may lead to the need for equity growth that the company cannot generate.
Combined with Declining Revenues: A high Debt to Equity ratio becomes an even more significant threat when the company is experiencing a downturn in its revenue. Even though the income is less, the company's debt payments have to be made, creating a potential crisis.
High Ratio in a Cyclical Industry: Companies that operate in cyclical industries (like construction and automotive) should keep their leverage low. Being highly leveraged during the upswing will make the company even more vulnerable when the downturn comes.
Approaching or Exceeding Debt Covenants: In some cases, firms are under loans that specify they must keep certain financial ratios. The nearer the D/E ratio gets to those upper limits, the more severe the potential consequences for the firm.
I have witnessed companies with a ratio over 5.0 have a hard time and even go bankrupt when the economic situation worsens. High leverage will make an investment sell unless backed by very specific strategic reasons.
One company whose financials I looked into a few years ago had a D/E ratio that increased from 1.5 to 4.5 in just two years. Their products were good, but the heavy debt burden overwhelmed them when their market segment shrank. Then, they had to go for a debt restructuring, and shareholders lost a lot of value.
Because this particular figure is frequently mentioned, I shall explain in detail what a D/E ratio of 1.5 signifies.
A ratio of 1.5 indicates that the company owes ₹1.50 for each ₹1.00 of shareholders' equity. To put it another way, if you were to divide the company's financing into portions, approximately 60% would be derived from loans and 40% from shareholders' contributions.
According to my perspective, 1.5 is the case of moderate leverage. For most sectors, it is neither conservative nor aggressive.
Investors should take it as: The firm is taking debt to boost the returns, but it's not taking too much risk. There is still a fair amount of equity cushion left to take in potential losses. This is considered by many sectors to be a level of leverage that is actually healthy.
Industry considerations: For a software business, the ratio of 1.5 might be considered high. In the case of a utility company, the leverage ratio of 1.5 would be very conservative indeed. A manufacturer would be most likely considered in the normal range with a ratio of 1.5.
When I look at companies with a D/E ratio of about 1.5, I tend to pay particular attention to other factors like interest coverage ratio, current ratio, cash flow stability, and debt maturity schedule. These extra metrics are the ones that aid me in figuring out if the company can easily service its debt.
According to my perspective, 1.5 is the case of moderate leverage. For most sectors, it is neither conservative nor aggressive.
Investors should take it as: The firm is taking debt to boost the returns, but it's not taking too much risk. There is still a fair amount of equity cushion left to take in potential losses. This is considered by many sectors to be a level of leverage that is actually healthy.
Risk-wise: There is a moderate financial risk. The firm has debts to pay, but it's not in a situation where it has to fight against creditors. As long as the firm remains profitable, it
When I look at companies with a D/E ratio of about 1.5, I tend to pay particular attention to other factors like interest coverage ratio, cash flow stability, and debt maturity schedule. These extra metrics are the ones that aid me in figuring out if the company can easily service its debt.
The long-term debt-to-equity ratio is a variation that, in my opinion, is especially helpful for certain kinds of considerations.
This version takes into account only the debt that has a maturity of more than one year in the future. The formula is as follows:
Long-Term D/E Ratio = Long-Term Debt / Total Equity
Why this matters: Short-term debt consists of items such as accounts payable and short-term credit lines that are used in day-to-day business. By considering only long-term debt, you can see the company's financial leverage through its structure more clearly.
I have checked that firms with a lot of short-term debt but little long-term debt usually have a different risk profile than the reverse case. Short-term debts, on the other hand, need to be renewed or settled quickly, thereby potentially leading to problems with cash flow. Long-term debt, on the other hand, guarantees stability and predictability.
When I use this ratio: When I assess firms with considerable seasonal changes in working capital, I primarily focus on the long-term D/E ratio. For instance, in the case of retailers, they might have a huge amount of short-term debt during the festive season while at the same time holding pretty manageable long-term debt.
Additionally, I consider it very handy in trying to compare different companies that are using different business models as far as supplier payment terms and inventory management are concerned.
Nevertheless, the total D/E ratio is the one I usually rely on in my analysis since it provides the broadest perspective of the overall leverage situation.
It's often the case that the debt-to-equity ratio gets mixed up with the debt ratio. I should clarify this for the purpose of edification because, in spite of their interconnectedness, they aren't the same.
Debt Ratio Formula: Total Debt / Total Assets
D/E Ratio Formula: Total Debt / Total Equity
The main distinction is the reference point for comparing the debt. The debt ratio indicates the part of the total assets that is covered by debt financing. In contrast, the D/E ratio reveals how much debt a company has compared to its shareholders' equity, which represents the book value of ownership in the company.
Example to illustrate the difference:
Company ABC has:
Total Assets: ₹1,000 Crore
Total Debt: ₹600 Crore
Total Equity: ₹400 Crore
Debt Ratio = ₹600Cr / ₹1,000Cr = 0.60 (or 60%) D/E Ratio = ₹600Cr / ₹400Cr = 1.5
Notice how they narrate different tales? The debt ratio states that 60% of the assets are backed by debt, while the D/E ratio states that there is ₹1.50 of debt for each ₹1.00 of equity.
To be honest, I use both. The debt ratio indicates the level of overall leverage measured as a percentage of total assets. D/E ratio, on the other hand, is more responsive to variations in capital structure and is, therefore, more appropriate for intercompany comparisons.
In my opinion, the D/E ratio is an investment analysis tool widely used and easy to compare between companies. The debt ratio, however, can be a good indicator of the risk of assets being lost in case the company goes bankrupt, especially when financial trouble arises.
Another common comparison is that between the D/E ratio and gearing ratio. Sometimes the terms are interchangeable, but there are minor differences.
Gearing Ratio has always been typical to denote distinct but interlinked measures that reflect financial leverage. The classic version is:
Gearing Ratio = Total Debt / Total Equity
Hold on, isn't that exactly what the D/E ratio was? Yes and no. In a lot of cases, particularly in the US, the gearing ratio and D/E ratio are considered to be identical. However, in certain countries and situations, the gearing ratio could be computed as:
Gearing Ratio = Total Debt / (Total Debt + Total Equity)
This direction gives you a portion of capital from loans, very much like a debt ratio.
My practical approach: Whenever I come across the term "gearing ratio," my first step is to look into the calculation method used to arrive at the number, since definitions might differ. Nevertheless, the idea behind it is the same, assessing the degree of a company's reliance on debt as opposed to equity.
I stay with the prevailing D/E ratio terminology in my groundwork in stock analysis simply because it is a standard metric that is easily understood and has no real ambiguity.
After several years employing this metric, I can confidently assert its transformation into one of my primary methods for concluding the financial field.

Simple and Quick: If a balance sheet is available, the calculation can be done in seconds. It is thus investment screening, which is very quick, that this ratio is particularly useful for. When I am going through a large number of corporations, this ratio enables me to pinpoint instantly the ones that deserve a thorough investigation.
Easy to Compare: The D/E ratio is easy to compare across companies, whereas some financial metrics are context sensitive and require adjustment. I can readily observe that Company A, which has a ratio of 0.8, is financed more conservatively than Company B, which has a ratio of 2.5.
Reveals Financial Strategy: The ratio speaks of managers' attitude to businesses' funding. Conservative policy usually means lower ratios, whereas aggressive growth usually means higher ratios.
Highlights Risk Level: It is one of the most evident signs of financial risk. The high ratio straight away indicates to me that the company could run into trouble if its revenues go down or if it has to refinance.
Useful Across Industries: The rule of thumb is that each industry has its own interpretation; however, the ratio is applicable almost everywhere. When I deal with tech startups or large-scale manufacturers, I can still do the ratio and use it.
Tracks Changes Over Time: I am able to tell whether the company is taking more or less financial risk depending on the D/E ratio I compare over the years. This trend analysis sometimes uncovers major strategic shifts.
To me, the combination of the D/E ratio with other metrics provides the most complete picture. For example, when I make use of a top stock screener like the one on Dhanarthi, I will narrow down the selection to companies with reasonable D/E ratios and then explore their cash flows and profits in more detail.
The D/E ratio is a metric I depend on considerably, but over time, I have realized that it has significant limitations as well. It is obvious that no one metric can unravel the whole story.

Doesn't Show Ability to Service Debt: This ratio is not always an accurate indicator of debt service capacity. A weak cash flow situation could make it hard for a company with a low D/E ratio to pay off its debts, whereas a company with a higher D/E ratio might manage its debts effortlessly if it has strong and stable cash flows.
Book Values Can Be Misleading: This ratio is calculated using book values that are extracted from the balance sheet, which might not represent the current market situation. The actual equity value of a company could be significantly higher or lower than what is recorded in the books.
Industry Differences: What is considered normal is highly dependent on the specific industry, and it has already been noted that the situation varies widely from one industry to another. Without additional context, the raw number could be misinterpreted. A D/E ratio of 2.0 could convey very different scenarios for a software company and for a utility company.
Timing Issues: A balance sheet at any given point in time is like a camera capturing a moment. A company may, for instance, have temporarily high debt at the end of a quarter due to seasonal reasons, which does not represent its usual condition.
Off-Balance Sheet Liabilities: Certain liabilities (such as operating leases under old accounting rules and some contractual obligations) are not recorded on the balance sheet. These hidden risks are missed by the D/E ratio.
Doesn't Account for Asset Quality: Two companies with the same D/E ratio can have different risk profiles based on their assets, where one has high-quality and liquid assets while the other has aged, hard-to-sell inventory or equipment.
Ignores Profitability: The D/E ratio is not able to reflect the situation wherein a very profitable company can support more debt than a loss-making one, and their difference in the D/E ratio.
This is why I never make investment decisions based on the D/E ratio alone. I always look at it alongside other metrics like interest coverage ratio, current ratio, return on equity, and free cash flow. When doing comprehensive financial statement analysis, I treat the D/E ratio as one piece of a larger puzzle.
Dealing with the D/E ratio in personal finance is something that I have found very advantageous among others. It is not common for people to consider their financial condition in this way, but the approach is indeed surprisingly fruitful.
Personal Debt: Here you should sum all your debts together—house, car, student, credit cards, and personal loans.
Personal Equity: You need to determine your net worth (assets total less liabilities total). It comprises the value of your house and other assets like retirement accounts, savings, investments, and even debts, minus any liabilities.
Your Personal D/E Ratio = Total Personal Debt / Net Worth
What a healthy personal ratio looks like:
I think that the majority of people should target a personal D/E ratio of less than 1,0, that is, more equity than debt. However, this depends on age and the situation.
A fresh-out-of-school professional might have a ratio that is higher than 1.0 since he/she have student loans and not much savings. This is usually fine if he/she is making money.
A middle-aged individual should be paying down his/her debt and accumulating assets at the same time so that his/her ratio decreases.
People nearing retirement should have very low or no ratios at all with a great deal of assets compared to their debts.
Knowing your personal D/E ratio gives you insight into your financial vulnerability due to income loss. Would your debt commitments be manageable in case of job termination? A personal D/E ratio that is high indicates that you are financially weak.
I have begun to track my personal D/E ratio yearly, and it has been quite revealing. The gradual reduction in the number as I decrease my debt and increase my assets provides me with the assurance that I am taking the right steps fiscally.
The same applies to corporations; the goal isn't necessarily to eliminate the debt. A mortgage at a low-interest rate can be justified. However, knowing your leverage will allow you to make more informed financial choices.
In case you are a proprietor of a company or a manager considering a high D/E ratio, then here are the most practical methods that I have witnessed being applied successfully.
Pay Off Debt: One of the most straightforward methods is to apply surplus cash flow to eliminate debt, starting with high-interest debt first. This results in an instant upturn in the ratio and a decrease in the amount subject to interest.
Boost Profitability: Holding back more profits instead of sharing them as dividends gradually increases equity. This is internal growth that fortifies the side of the equation where equity exists.
Attract Equity Capital: The creation of new shares results in the inflow of cash without the incurring of debt. However, this causes the existing shareholders' ownership to shrink and therefore needs careful thought.
Maximize Asset Efficiency: Transactions involving the sale of assets that are not used or not related to the business at all lead to the generation of cash for paying off debts. In fact, there are firms that I've known to have done this and come out with such enhanced ratios due to the sales of unproductive and non-profit-generating divisions.
Refinance High-Rate Debt: Although this does not impact the D/E ratio directly, it allows for the debt service burden to be lessened through refinancing the high-interest debt at lower rates, and thus, cash flow is released.
Debt-to-Equity Swap: The creditors could, in certain cases, be willing to exchange the debt for equity ownership. This scenario is more likely to happen in case of financial distress, but it significantly enhances the ratio.
Cash Flow is Key: A strong and stable cash flow is what you need to pay off the debt or retain the earnings. Either option will contribute to your ratio being better in the long run.
Wait: The increase of the D/E ratio is usually not a quick fix. It needs no less than the prolongation of effort and the use of disciplined management of finances over several quarters or even years.
Companies that effectively enhance their ratios usually experience an increase in their stock prices as a result of the investors' perception of lower risk associated with them, which positively impacts the company's intrinsic value. In case you are in the process of making your company's fundamentals better, stock analysis tools and resources could help you see where you stand in comparison with the industry peers.
The debt-to-equity ratio is a simple yet powerful tool for evaluating a company's financial risk. Comparing total debt to total equity helps you judge how responsibly a business uses leverage. However, its meaning depends on industry context and should always be assessed alongside other financial metrics. As you analyze companies, practicing this ratio across peers using stock screener tools will sharpen your judgment and strengthen your investing decisions.
Disclaimer: This analysis is for educational purposes and not financial advice. Please consult a financial advisor before making investment decisions.
1. What is the debt to equity ratio and why does it matter?
The debt to equity ratio compares how much a company owes to how much the owners have invested. It helps you understand financial risk high ratios mean more borrowed money, which can be risky during tough times. Investors use it to assess company stability before investing.
2. How do you calculate the debt to equity ratio formula?
The Debt to equity ratio formula is simple: divide total debt by total equity. You'll find both numbers on a company's balance sheet. For example, if a company has ₹500 Crore in debt and ₹250 million in equity, the ratio is 2.0 (₹500Cr ÷ ₹250Cr).
3. What's considered an ideal debt equity ratio for most companies?
The ideal debt equity ratio usually falls between 1.0 and 2.0 for most industries. However, this varies significantly by sector. Tech companies often have ratios below 0.5, while utilities might safely operate at 2.0 or higher. Always compare companies within the same industry for accurate assessment.
4. What is the main difference between debt and equity?
The debt and equity difference is straightforward: debt is borrowed money that must be repaid with interest, while equity is money from owners or shareholders that doesn't require repayment. Debt creates fixed obligations, whereas equity provides a financial cushion during downturns without mandatory payments.
5. Where can I find the debt equity ratio in a balance sheet?
The debt equity ratio in balance sheet components are clearly labeled. Look for total liabilities (debt) under the liabilities section and shareholder's equity near the bottom. Simply divide total debt by total equity. Most financial websites and annual reports display these numbers prominently for easy calculation.
6. Is a high debt to equity ratio always bad for a company?
A high ratio isn't always bad—context matters. Some industries like utilities naturally operate with higher ratios because they have stable cash flows. However, a ratio significantly above industry average or one that's rapidly increasing could signal financial trouble, especially if revenues are declining.
7. What does a debt to equity ratio of 0.5 mean?
A ratio of 0.5 means the company has 50 cents of debt for every dollar of equity. This indicates conservative financial management with more owner investment than borrowed money. It's generally considered low-risk, though it might suggest the company isn't fully utilizing available leverage to boost returns.
8. Can the debt to equity ratio be negative?
Yes, a negative debt to equity ratio occurs when a company has negative equity, meaning liabilities exceed assets. This is a serious red flag indicating financial distress and potential bankruptcy risk. Companies with negative ratios often struggle to survive unless they can quickly raise capital or restructure debt.
9. How often should I check a company's debt to equity ratio?
Check the ratio quarterly when companies release financial reports. Also review the trend over several years to see if leverage is increasing or decreasing. Significant changes in the ratio often signal important strategic shifts or financial challenges that deserve closer attention before making investment decisions.
10. What's the difference between debt ratio and debt to equity ratio?
The debt ratio divides total debt by total assets, showing what percentage of assets are debt-financed. The debt to equity ratio divides debt by equity, showing the relationship between borrowed and owned capital. Both measure leverage differently—debt ratio uses assets as the denominator while D/E uses equity.
11. How can I improve my company's debt to equity ratio?
Pay down debt with excess cash flow, increase profitability and retain more earnings, or raise equity capital through stock offerings. You can also sell non-core assets to generate cash for debt repayment. Improving the ratio takes time and requires disciplined financial management over multiple quarters.
12. What debt to equity ratio is too high for investors?
A ratio above 3.0 is generally considered high risk for most industries, requiring strong justification. Ratios above 5.0 enter dangerous territory unless the company operates in a sector like financial services where high leverage is normal. Always compare against industry peers rather than using absolute numbers.
13. Should I use short-term or long-term debt for calculations?
Most analysts include both short-term and long-term debt for a comprehensive view of total leverage. However, some prefer focusing only on long-term debt to see structural financial leverage. Calculate both versions—total debt gives you a conservative estimate while long-term debt shows permanent capital structure.
14. How do I interpret a debt to equity ratio of 1.5?
A ratio of 1.5 means the company has ₹1.50 in debt for every ₹1.00 in equity—roughly 60% debt and 40% equity funding. This represents moderate leverage that's neither too conservative nor too aggressive. It's healthy for many industries, though context matters based on sector norms and cash flow stability.
15. What industries typically have higher debt to equity ratios?
Utilities, real estate, and financial services naturally have higher ratios. Utilities often range from 1.5 to 2.5 because stable cash flows support more debt. Banks can exceed 5.0 since borrowing is their business model. Manufacturing and retail typically fall between 0.5 and 2.0 depending on capital intensity.
Share Market
IPO
Artificial Intelligence
Semi Conductor