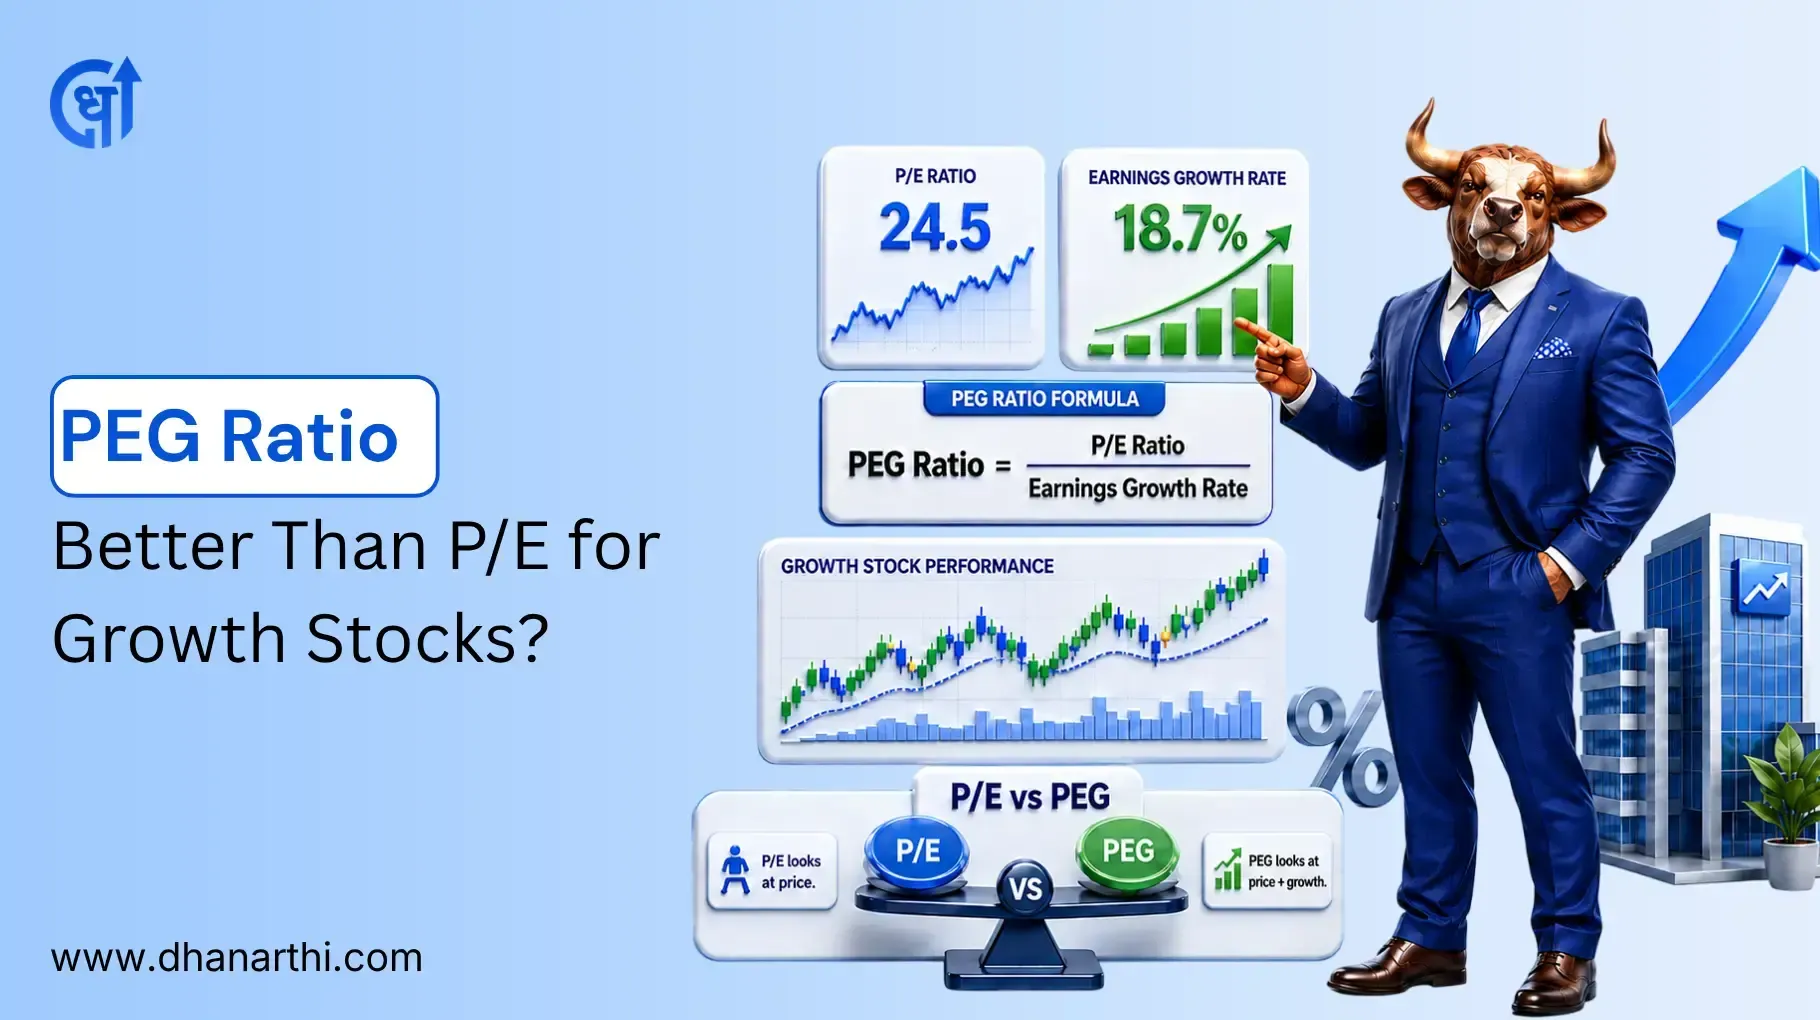
PEG Ratio: Better Than P/E for Growth Stocks?
July 1, 2026

TABLE OF CONTENTS
Get an AI Summary of This Post Using The Tools Below.


It is a clear memory to me of my first meeting with a stock chart. I was so confused about what I was seeing. Time jumped ahead a few years, and I realized that technical analysis had already become one of my skills in timing trades and market understanding that was on a higher level.
If you're interested in knowing how the traders make their predictions about the next stock price direction or when they take a position in the market, you have come to the right place. Whether you're looking for stock market trading tips for beginners or advanced strategies, let me explain everything that I know about technical analysis in a very simple manner.
Technical analysis is the practice and technique of Understanding price charts to foresee the direction of price movements. Rather than examining the financial statements of the company, one analyzes past price trends, trading volumes, and utilizes different indicators to decide on trades.
In a Briefly, technical analysis is the study of historical price movements to make predictions about future price movements. The whole process is built on the idea that price already reflects everything that is known, and that price changes come and go in specific, identifiable patterns.
Technical analysis is not a new concept at all. It goes back to 17th century when lotus traders in Japan applied candle patterns for the price predictions of rice. Later, in the late 19th century, Charles Dow worked out the theory that we call Dow Theory today. Since then, many traders have come up with new indicators, patterns, and techniques.
Three basic assumptions are the foundation of technical analysis. If one gets acquainted with these technical analysis principles, everything else would be quite easy to comprehend.
Market Discounts Everything This theory claims that the price already incorporates all the information that is available. Current price has already taken into account everything company news, economic data, market sentiment, earnings reports, etc.
Price Reflects All Available Information Initially, I expressed doubt when I was told this. However, consider the following: in the case of good news, buyers act as traders, and then the price goes higher as a result of their buying.
Efficient Market Hypothesis Connection This notion is related to the efficient market hypothesis, a theory that claims markets are quick and accurate in assimilating information. The theory has detractors, yet the main idea remains valid: the new information is promptly reflected in the prices.
Although prices are assumed to move at random, it is actually due to a trend.
Trend is Your Friend Concept The ancient proverb "the trend is your friend" has been my anvil upon which I have hammered out good trades and bad trades. Trading against the trend is similar to swimming against a powerful current very tiring and most of the time not successful. My learning to trade with the trend has made a wonderful impact on my performance.
History Repeats Itself Psychological factors influencing trading decisions remain more or less constant. So, it's like this: the same old price patterns that were profitable before are still likely to be profitable again.
Market Psychology and Crowd Behavior Fear and greed rule the market. Traders give up their shares in panic when fear sets in, and prices fall steeply. On the other hand, simply put, when the price of an asset increases substantially, greed will take over the market,t and zillions will queue up to buy the asset. Such emotional patterns can be seen throughout the history of the market.
There are several key theories that form the foundation of modern technical analysis. It would be best if I grouped them for you.
Dow Theory Charles Dow invented one of the initial concepts of understanding market trends, and his thoughts are still a part of stock market technical analysis in the present time.
Six Basic Tenets Dow Theory is made of six essential principles: first, the market discounts everything; secondly, there are three different kinds of trends; thirdly, trends consist of three phases; fourthly, volume supports trends; fifthly, indices need to confirm one another; and lastly, trends last until clear reversal signals show up.
Primary, Secondary, and Minor Trends The primary trends are the longest, and they may last for months and even years, and they are the main direction of the market. When it comes to timing, secondary trends are always on the move and last only a few weeks to months, usually in an opposite direction to the primary trend. In contrast, minor trends are very short-lived, lasting only days or weeks. Consider them as tides (primary), waves (secondary), and ripples (minor).
Elliott Wave Theory Ralph Elliott's theory of market behavior through mass psychology was very innovative, as he discovered that the market works in repetitive wave patterns. Immediately, the theory became very complicated but at the same time, the fundamentals were still beneficial.
Wave Patterns and Cycles According to Elliott, the market moves in a five-wave pattern in the direction of the trend and makes a three-wave correction in the opposite direction.
Support and Resistance I wish I weren't laughing, but the truth was driven in the opposite direction.
How to Identify Key Levels Support is a certain price level at which the demand for the asset is so great that it can stop the fall in price. Resistance is the opposite situation, where the selling pressure prevails, preventing the further rise. I pinpoint these levels by examining past occurrences of the stock having reversed its course several times at the same price points.
Role Reversal Concept Here is a neat example: whenever the price manages to go past the resistance and break it, that same resistance usually turns into new support. The same case in reverse broken support turns to resistance. This occurs because the traders keep these levels in their memories, and their actions deviate in accordance.
Different charts show the same price data in different ways. There are benefits to each.
A line connecting basket-constellation prices is in the section where chart types are discussed.

When to Use* I use line charts if I am looking for a pure and clear view of the trend, totally free of clutter. They are great for a bigger picture minus the noise.
Advantages and Limitations Line charts are quite straightforward and reveal the trends in a very clear manner. Nevertheless, they just present the closing prices and therefore miss an important part of the intraday price action. Thereby, the information about the highs, lows, and opening prices gets lost.
Example Think about the scenario where on Monday, a stock finished its trading day at ₹100, on Tuesday its price increased to ₹105, then on Wednesday it slightly decreased to ₹103, and finally on Thursday the price rose to ₹108.
Bar charts in technical analysis show more information than line charts.

Components (Open, High, Low, Close) Every vertical line corresponds to a single time period. The high is at the bar's top, and the low is at the bottom. A short horizontal line to the left indicates the opening price, while a line to the right indicates the closing price.
Example A bar with the high of ₹110, low of ₹102, open of ₹104, and close of ₹108 indicates that the stock has opened at the lower end of the day's range and closed at the upper end. This is bullish price action, commonly observed in intraday trading where traders capitalize on these short-term movements.
This is one of the most common chart styles today, and it is most loved by many traders.

Japanese Candlestick History Candlestick charts were created centuries ago by Japanese rice merchants. It was not until the 1980s that the method reached the Western market and changed technical analysis radically.
Anatomy of a Candlestick Every candlestick consists of a body (the thick part) and wicks or shadows (the thin lines above and below). The body represents the interval between opening and closing prices. The wicks represent the highest and lowest prices.
Color Coding (Bullish vs Bearish) Green or white candlesticks depict a situation where the close was higher than the open, hence the term bullish. On the other hand, red or black candlesticks depict the opposite, thus the term bearish, since the close was lower than the open.
Why Traders Prefer Candlesticks Candlesticks are quite easy to understand visually. Each period of trading can be quickly assessed for buyer or seller dominance. Moreover, along with the patterns, certain candlestick patterns also serve as strong trading signals, which will be discussed afterwards.
Example The candle of the day was a long green one with tiny wicks, which indicatesa strong buying force all the way through the session. The sellers and buyers could not make up their minds, and thus the day was marked with a tiny body and long wicks (a doji).
Heiken Ashi The modified candlesticks mentioned above help to reduce price fluctuations and make it easier to identify trends. They are my tools when it comes to eliminating the market noise.
Point and Figure The charts in this case do not consider time as a factor and instead put the emphasis solely on important price changes. They are very useful for pinning down support and resistance levels.
Renko Charts Renko charts are only constructed with new bricks when the price movement reaches a predefined amount, therefore eliminating minor variations. They depict trends very clearly indeed.
The identification of chart patterns is the point at which technical analysis becomes truly captivating. These patterns have been effective for ages as they are a reflection of the repetitive human nature.
There are certain signs to suggest that there could be an end to the current paradigm.
The inverse head and shoulders resemble three troughs, with the center one (the head) having the greatest depth. A strong buy signal occurs when the price surpasses the neckline that unites the tops situated between the valleys.
A double bottom develops when the price reaches the support area two times and goes up both times, creating a "W" shape. The second bounce usually results in a substantial increase.
A triple bottom pattern is like a double bottom, but it consists of three times the support level being touched. It is not very common, but when it does, it is quite powerful.
A falling wedge is established when both support and resistance lines are sloping downwards, but at the same time the distance between them is getting smaller. The breakout is normally in the upward direction.
The bullish rectangle is a pattern that happens in a downtrend, and the price goes sideways first before moving up.
Head and shoulders is the opposite of the inverse head and shoulders pattern. It is a formation of a head with two shoulders on both sides. The breakthrough below the neckline indicates the downward trend reversal possibility.
A double top is created when the price reaches the resistance level for the second time and does not succeed in breaking through, thus forming an "M" shape. This usually results in a price drop.
A triple top pattern is similar to a double top, but in this case, three resistance-busting attempts have failed.
The rising wedge is characterized by the convergence of both support and resistance lines that are moving upwards.
Though it appears in an uptrend, it is normally followed by a downward break.
A bearish rectangle is the pattern that appears during the uptrend when the price is moving sideways to consolidate before reversing lower.
These suggest the current trend will resume after a brief pause.
An ascending triangle pattern shows a strong resistance line and weak support. It mostly happens that the trend will break through the resistance line.
A bull flag pattern can be said to be a declining rectangular channel that is created after a steep price gain. The breakout movement continues the existing upward trend.
A bull pennant formation is very similar to the bull flag; however, the only difference is that it is a small triangle that is drawn instead of the rectangular one.
The security price chart depicts the cup-and-handle pattern quite similarly to a teacup. Most of the time, the price rises sharply after forming the rounded bottom (the cup) and doing a little pullback (the handle).
A descending triangle features a horizontal support line at the bottom and a descending resistance line at the top. Such a pattern in a downtrend generally results in a downward break.
A bear flag has an upward slope while the price is declining, indicating a pause before the drop resumes.
A bear pennant is a small triangle that occurs during a downtrend, and it usually results in a continued drop.
These can break in either direction.
Support and resistance come together, forming a triangle. Most of the time, the direction of the breakout follows the previous trend, but this is not always the case. I prefer to wait for the break before entering trades on these.
Channels are formed by the connection of parallel support and resistance lines. The price oscillates between the two lines until it eventually breaks out. Thus, trading within the channel may generate profits purchase close to support, resale close to resistance.
It is one thing to know about patterns, but another thing to use the fact that they are predictable to make money off them.
Identifying Patterns Correctly Newbies are Likely to see patterns all over the place. Gradually discover the features of sound patterns. A price movement on the chart is not necessarily a pattern that can be traded.
Entry and Exit Points My usual practice is to go in as soon as there is a breakout from the pattern accompanied by high volume. In the case of a head and shoulders this is done by taking a position on the downside of the neckline. For a bull flag, I buy when the price exceeds the resistance of the flag.
Setting Price Targets Numerous chart patterns have their respective price targets that are quite easy to predict. In the case of a head and shoulders pattern, first, find the distance between the head and neckline, then apply this distance downward from the point of neckline breakdown. This way, you get a target that is quite reasonable.
Volume Confirmation Typically, valid breakouts show an increase in volume as well. In case there is little volume accompanying a breakout, it could be a false signal. I got to know this through hard experience after getting caught in a few low-volume breakouts in the early stages of my trading career.
Indicators are mathematical computations leaning on price and volume, which assist in spotting trends, momentum, and possible reversals. I'd like to communicate the most beneficial ones that I have discovered.
Indicators are mathematical computations leaning on price and volume, which assist in spotting trends, momentum, and possible reversals. I'd like to communicate the most beneficial ones that I have discovered.
Moving Averages (SMA, EMA, WMA) The simple moving average (SMA) computes the mean price for a certain time frame. The exponential moving average (EMA) assigns a higher importance to the latest prices. The weighted moving average (WMA) similarly considers the current data more, but in a different way than the EMA.
The 50-day and 200-day moving averages are the tools I rely on for spotting long-term trends. A golden cross bullish signal is the event when the 50-day moving average goes up through the 200-day one. When it goes down, the event is called a death cross a bearish signal.
Moving Average Convergence Divergence (MACD) The MACD indicates the connection between the two moving averages. A bullish signal is generated when the MACD line crosses over the signal line, while the opposite case is for a bearish signal. Additionally, I monitor the divergence between MACD and price as it is a very strong reversal indicator.
Average Directional Index (ADX) ADX gauges the strength of a trend on a scale from 0 to 100. A reading over 25 shows a strong trend. A reading under 20 points out a feeble or no trend at all. This gives me an idea if I should apply trend-following or range-trading methods.
Parabolic SAR Dots appear over the price or under it. The turning of dots from above to below price is a buy indication. In contrast, the turning from below to above is a sell signal. Awesome for trailing stops.
Ichimoku Cloud Initially, this appears complicated, but it gives fantastic information just like that. The price above the cloud is bullish, and below it is bearish. I predominantly use it for spotting support, resistance, and trend direction.
Initially, this appears complicated, but it gives fantastic information just like that. The price above the cloud is bullish, and below it is bearish. I predominantly use it for spotting support, resistance, and trend direction.
Relative Strength Index (RSI) RSI is an oscillator that moves within the range of 0 to 100. The value of more than 70 is considered an overbought condition, while the value of less than 30 is an oversold condition. I don't sell stocks immediately when the RSI reaches 70, but I give a lot of attention to reversal signals.
Stochastic Oscillator This indicates the current price in terms of its past price movements over a given time frame. It also highlights overbought and oversold areas just like the RSI does. For swing trading, I like to use stochastic.
Commodity Channel Index (CCI) CCI indicates the degree to which the price has changed in comparison to its average. A reading of more than +100 gives a signal for an overbought situation; on the other hand, a reading below -100 means the opposite for the market. The indicator is very helpful, especially in the commodity markets.
Rate of Change (ROC) ROC demonstrates the percentage variation in price throughout a certain time period. A positive ROC signals an increase in momentum, while a negative one signals the opposite.
Williams %R This oscillator is quite like stochastic, but with the opposite direction. It extends from 0 to -100, where the values over -20 are deemed as overbought, and those under -80 are called oversold.
These measure price fluctuation intensity.
Bollinger Bands The volatility causes these bands to change their sizes accordingly. The price is expected to be inside the bands for around 95% of the time. The price being at the upper band might indicate an overbought condition. The case where the lower band is touched indicates an oversold situation. I find it very useful to use Bollinger Bands for spotting volatility squeezes before significant price movements.
Average True Range (ATR) ATR assesses the typical price movement over a predetermined time frame. The greater the ATR, the more volatile the market. I apply this for determining stop-loss distances higher stops in high ATR areas, lower ones in low ATR surroundings.
Standard Deviation The standard deviation is a statistical measure that indicates the extent to which the price fluctuates around its mean. A higher standard deviation is a sign of more volatility.
Keltner Channels ATR-based volatility bands are similar to Bollinger Bands but differ in that they use ATR rather than standard deviation. Some traders find these more comfortable to use in trend-following systems.
Volume confirms price movements. Never ignore volume.
On-Balance Volume (OBV) OBV takes the volume of the period and adds it when the day is up and takes it out when the day is down. If the OBV is increasing, it indicatesa trend upwards; if it is decreasing, it indicatesa trend downwards. Also, OBV showing a different trend than the price could be a warning signal for a reversal.
Volume Weighted Average Price (VWAP) VWAP represents an average price, outright dependent on trading volume. A significant number of institutional traders rely on this price indicator. If the price is situated above VWAP, it tends to be interpreted as bullish, whereas if it is below, it is considered bearish.
Money Flow Index (MFI) MFI resembles the RSI indicator, with the only difference that it uses volume for its calculation. It delivers the result of the market's prevailing buying and selling activities. Levels exceeding 80 indicate overbought conditions,s while levels under 20 indicate oversold conditions.
Accumulation/Distribution Line The A/D (Accumulation/Distribution) indicator tracks the movement of a stock by indicating whether it is being sold off (distributed) or purchased (accumulated). The bullish price trend is confirmed by the ascending A/D line along with the higher price level.
Chaikin Money Flow It helps traders and investors gauge the amount of money flowing into or out of a security or a stock for a given time. Positive figures spell buying pressure, negativesspell selling pressure.
These help identify key price levels.
Fibonacci Retracements Fibonacci levels (23.6%, 38.2%, 50%, 61.8%, 78.6%) frequently serve as support or resistance during pullbacks after a price move. I continuously utilize these to pinpoint possible entry points.
Fibonacci Extensions Fibonacci ratios employ alternative calculations to determine market price targets beyond previous highs or lows. Used for setting potential profit targets.
Pivot Points Calculated from the previous period's highest, lowest, and closing values, pivot points indicate the possible support and resistance for the current period. They are widely employed by day traders.
Trend Lines The simple act of drawing lines that connect the swing lows in an uptrend or the swing highs in a downtrend is sufficient to create dynamic support and resistance levels. Do not undervalue the strength of uncomplicated trend lines.
Japanese candlesticks are amongst the most trusted technical analysis indicators.
Doji candles have almost the same price for opening and closing, indicating uncertainty in the market. In some instances,s they confirm a change of trend after the strong movement of the market.
Hammer is characterized by a tiny body located at the top and a long shadow at the bottom. If it is placed at the bottom of downtrends, it means that the buying pressure is growing.
Hanging Man is similar to a hammer, but it signals the end of the bullish trend. It is a sign of reversal to the downside.
Shooting Star consists of a short body at the bottom with a long upper shadow. If it is at the top of an uptrend,s it means that there is a possibility of selling pressure.
Engulfing patterns are formed when the body of one candle completely covers the body of the previous one. A bullish engulfing at support indicates that it is time to buy. A bearish engulfing at resistance, on the other hand, indicates that it is time to sell.
A piercing line is formed when a bullish candle opens at a lower price than the previous bearish candle's close, but it still manages to close above the midpoint of that candle. This situation indicates that the bulls are gradually taking over.
Dark cloud cover is the situation in which the bears take the same action as in the previous case, but vice versa - they will be opening a bearish candle above the previous bullish candle's close, yet still closing it below the midpoint.
The morning star is made up of a negative candle, a tiny indecisive candle (star), and a positive candle. This pattern of three candles is a signal for a bullish reversal.
The evening star is the opposite of the morning star, where the pattern consists of a bullish candle, a star, and a bearish candle, foreshadowing the possible downtrend.
The three white soldiers are three successive and growing bullish candles. It is the strongest signal for the bullish continuation.
Three black crows are three successive bearish candles that keep getting lower. It is the strongest signal for the bearish continuation.
Some want quick profits, so they can work with smaller time frames.
Scalping (1-minute to 15-minute Charts) Boycotts led by elite corporations to protect or lobby as a means of thousands of profit trade-in as many as hundreds per day while putting forth trade profiteering ideas, so right at the margin of being aggressive, one way or the other."Not that we will trade, trade again; if anything, it has afforded give rewards," he added.
Day Trading (15-minute to 1-hour Charts) Day traders hold no positions at the end of the market. They rely on intraday charts and technical indicators to seize the moment of price movements occurring within the day. Understanding stock market timings in India is essential for day traders, as they need to monitor positions actively throughout the trading session. This is a tough job, and it needs continuous monitoring.
Swing Trading (4-hour to Daily Charts) Swing traders keep their trades open for several days to weeks to benefit from the bigger price movements. The reason for my liking of this method is that it does not call for permanent checking. It is possible to study the graphs at night and to submit the transactions in accordance with that.
Position Trading (Daily to Weekly Charts) The position traders take on can be from a few weeks to months, and they concentrate mostly on the major trends. Major trends, together with the use of both technical and fundamental analysis, lead to longer-term investments.
Long-Term Investing (Weekly to Monthly Charts) Over the years, investors who focused on the long term have primarily employed technical analysis to choose appropriate times to invest in companies that are sound from the fundamentals point of view. If your portfolio-building strategy is long-term and focused on solid fundamentals, then tech tools like Dhanarthi.com will assist you in discovering the best companies, while technical analysis will tell you when to buy.
How to Choose the Right Timeframe Align your timeframe with your lifestyle and character traits. Having a full-time work regimen means that day trading will not be a suitable option for you. If you are patient and prefer to wait for a longer time for the profits, swing or position trading is the right choice for you.
Multiple Timeframe Analysis Let me share with you a great trading strategy, and that is to first analyze multiple timeframes before opening a trade. The first thing I do is to look at the daily chart to identify the main trend, and then I enter the 4-hour chart to identify the best time to get into the market. The long-term perspective gives the general idea, while the short-term perspective shows the best moments to enter the market.
Go to the Dhanarthi website.
If you're new, create a free account by entering your name, email, and password or just sign up with Google.
Already have an account? Simply log in.

After logging in, go to the "Stocks" tab on the top menu.
Now type the name of the company or stock symbol you want to analyze in the search box (e.g., Reliance, Infosys, etc.)

Once you select a stock, you’ll see a complete technical analysis dashboard showing:

Overall Score – Stock’s overall technical outlook (Bullish / Bearish / Neutral)
Trend Score – Strength and direction of the price trend
Momentum Score – Price momentum based on key indicators like RSI, CCI, ROC
Volatility Score – How much the price is fluctuating (using Bollinger Bands, ATR)
Volume Score – Trading activity strength (e.g., MFI)
Trend Indicators – SMA, EMA values with buy/sell signals
Momentum Indicators – RSI, CCI, ROC readings with status
Volatility Indicators – Bollinger Band levels, ATR value
Volume Indicators – Money Flow Index with trend bias
Color-Coded Signals – Green = Strong, Yellow = Neutral, Red = Weak for quick reading
👉 Note: Each ratio is color-coded (Green = Strong, Red = Weak), helping you instantly assess where the company performs well and where it needs improvement.
Theory is good to know; however, in practical applications, we get to prove technical analysis.
Timing Market Entries Technical analysis is a method that is very good at deciding when to enter a trade. The trader is not going to buy randomly but rather wait for the price to pullback to a major support in an uptrend, or even for a breakout from a sideways consolidation pattern. The new entry prices will be much better than before.
Profit-Taking Strategies Using a resistance level, Fibonacci extensions, or indicators showing overbought conditions, I employ technical analysis to pinpoint the potential spot of selling pressure.
Breakout Trading Breakout trading has been a source for some of my most profitable trades. A stock's breakout above the resistance line, accompanied by impressive volume, usually propels its price up, at least for some time. Reversal is true for breakdown trades.
Technical analysis is not just about identifying opportunities; it is about risk management as well.
Position Sizing I apply ATR for the purpose of deciding how much to invest in a particular asset. If the market is more volatile, then the size of the position would be smaller, and the other way around fora less volatile market. This way, the risk remains the same for all the trades.
Stop-Loss Placement Strategies In long positions, I set the stop below the support level, and in short positions, I set it above the resistance level. Understanding short selling is crucial when setting stops for bearish trades. The specific distance is determined by the ATR—I allow the trade some space to move without taking too much risk.
Risk-Reward Ratios My target is a minimum 2:1 reward-to-risk ratio. In case my stop-loss is the loss of ₹5, my target would be ₹10 at least. By means of technical analysis, I can specify the trades on the basis of this ratio.
Portfolio Diversification Technical analysis that is done very well can still lead to the failure of a single trade. A good way to manage such losses is to spread your investment over several, in which case the single loss's effect will be minimized.
Fear and Greed Index An amalgamated marker that seeks to measure the market feelings. Extreme fear is often a harbinger of buying possibilities, whereas extreme greed generally alerts in favor of caution.
Put/Call Ratios High put/call ratios point toward fear and potential market bottoms. On the other hand, low ratios often indicate complacency and possible tops. Understanding options vs stocks helps traders interpret these ratios better, as put/call ratios specifically measure options market sentiment and can signal shifts in trader positioning.
VIX (Volatility Index) High VIX indicates high expected volatility, which often implies fear driving prices lower. For Indian markets, tracking India VIX provides an opportunistic indication of market sentiment and potential bottoms. Low VIX readings typically suggest complacency and possible market tops.
Sentiment Indicators Surveys done on sentiment keep revealingwhetherf the traders are optimistic or pessimistic. At the extremes, contrarian traders take the opposite position of the major players.
While following the basic rules laid out remains constant across markets, they differ in details.
Sector Rotation At various economic stages, varied industries perform well. Relying on technical analysis enables the accurate determination of sectors that are exhibiting strength in comparison with the broad market.
Market Breadth Indicators Here, breadth will measure the internal strength of a move, in other words, how many stocks are actually participating in a move of the index. A low breadth (few stocks are rising as the index rises) warns of the fragility of the rally.
Relative Strength Analysis This evaluation shows how the performance of each stock compares with that of the market or sector.
I like to have shares that show relative strength; they are even more powerful when the market is down.
Currency Pair Correlations Certain currency pairs tend to move together (positively correlated), whereas others move in the opposite direction (negatively correlated). Analyzing these relationships provides a better and more accurate analysis.
Forex-Specific Indicators Forex traders can use the average hourly range tool as one of the most important signals or indicators to estimate the normal movement of the currency pairs.
Session-Based Trading The forex market is open all day and night, but the price change is more and more concentrated at the specific sessions (London, New York, Tokyo) respectively. The technical patterns that come during high-volume sessions are quite reliable.
24/7 Market Considerations The Crypto Market Never Closes, Creating Different Technical Patterns, Therefore Weekend Moves Can Be Significant Due To The fact that traditional Markets Are Closed.
High Volatility Strategies Due to Crypto's Extreme Volatility, A Further Wider Stop And More Significant Position Spacing Is Required For A Trade To Be Profitable. Therefore, As You Would Trade In Stocks, You May Have To Either Adjust Your Trading Style To Your Particular type of cryptocurrency or create a New Cryptocurrency Trading Strategy.
Whale Watching and Order Flow Whales Are Large Holders Of Cryptocurrency And Control The Movement Of The Cryptocurrency Market. Being Able To Track Large Orders And The Amount Of Interest In An Order Book Provides Additional Context To The Market.
Seasonality Patterns Numerous commodities are characterized by seasonal patterns. Natural gas consumption increases in winter, and agricultural products move along planting and harvesting cycles. The combination of seasonal analysis and technical analysis leads to better timing.
Contango and Backwardation These futures market situations influence the rolling positions. Recognizing them assists the commodity traders in preventing surprise charges.
Open Interest Analysis The increase in open interest analysis, along with higher prices, is confirmation of the trends in the futures markets. The difference between open interest and price is a warning of possible reversals. Open interest helps traders understand whether new money is flowing into a trend or if existing positions are being closed.
You don't need expensive software to start, but good tools help.
Trading Software (TradingView, MetaTrader, ThinkorSwim) I prefer TradingView because of its social capabilities and an uncomplicated interface. It works across all markets. MetaTrader is famous for forex trading. ThinkorSwim is a high-end platform for advanced traders. Most share brokers in India now provide integrated charting tools with their trading platforms, making technical analysis accessible to retail traders.
Charting Software Features Search to find sites that have drawing features, several indicators, personalized alerts, and chart templates. Strategies can be tested with the help of backtesting capabilities.
Mobile Trading Apps The majority of the platforms have mobile applications. I make use of them to track trades, but ratheruse a desktop to analyze.
Backtesting and Automated Trading Software High-level traders develop programs that operate on technical signals. Backtesting trading strategies is used to determine the past performance of strategies. Although this is helpful, it is important to keep in mind that it does not indicate future performance based on the past performance. Proper backtesting helps you understand how your strategy would have performed under different market conditions.
Setting Up Your Workspace My charts are neat, and I only have a few major indicators. The number of lines and indicators is too many to be confused with. Keep it simple and introduce complexity where necessary.
These are the majority of the mistakes that I made. Learn from my errors.
The Over-Reliance on Indicators (Indicator Overload) The,n when you add a ten indicator,s you are not ten times more accurate. It gives mixed signals and stalemates. Only stick to two or three complementary indicators.
Ignoring the Bigger Trend I have been beaten by going against the trend too often. Now I just admire the general direction of the trend and make my deals with it rather than in opposition to it.
Not Using Stop-Losses Each of the veteran traders has a nightmare story of a stop-loss. Set your stops and honor them. A single ill-timed trade may erase months of revenue.
Trading Against the Trend Counter-trend trading is somewhatof a gamble that may succeed. The trend-following strategies need to be acquired by beginners.
Confirmation Bias We all want to be right. The confirmation bias causes us to observe signals that confirm our current stance. Be objective and always ready to say when you are wrong.
Failure to Adapt to the Market Conditions Trending market strategies cannot be successful in choppy markets. Be aware of the change in conditions and change accordingly.
Chasing Trades (FOMO) The fear of missing out leads to horrible choices. If you miss a trade, let it go. There is always another opportunity. Volume Confirmation is disregarded. Price movements are usually unsuccessful. Never respond to price signals without first checking volume.
Using Wrong Timeframes When you are a swing trader, you should not analyze 1-minute charts, as this becomes noise and leads to bad decisions. Use your time of analysis to match your trading style.
Here's what works based on my years of experience.
Combine Multiple Indicators from Different Categories Utilize any trend indicator, one momentum indicator, and check the volume. This helps provide a good balance without causing any confusion.
Always Confirm with Volume I can't stress it enough. Volume confirms price movements. Ignore this at your own risk.
Practice on Demo Accounts First First, conduct your technical analysis on paper or through demo accounts before risking any real money. You can strengthen your confidence and improve your method by going through the process without the stress of finances.
Keep Learning and Adapting The subject of market trends is an ongoing one. The strategies that were efficient a couple of years back are no longer effective today. Hence, we should continuously study, participate in webinars, and read new books besides the books and the successful traders from whom we learn.
Maintain Trading Discipline It is of utmost importance to stick to your trading plan without exception rather than to find the perfect strategy. Patience and self-control are the characteristics that make successful traders different from the rest.
Use Proper Risk Management Always limit the amount of capital you risk on a single trade to just 1-2%. This will help you to remain in the game even during the not-so-favorable periods of losses that are bound to happen sooner or later.
Keep Emotions in Check Fear and greed are the downfall of traders. When emotions seem to be getting the better of your trade, it is wise to step back and take a break. Tomorrow, the market will still be there.
Document All Trades Maintain a trading diary where you can note down the reasons for your entries, your feelings, the results, and what you have learned. This will boost your learning process.
Follow a Trading Plan As much as you can, provide your narrative with details such as rational parameters and existing data instead of generalisations, and elaborate on how the rules should be applied.
Would you like me to discuss why I find technical analysis important in spite of criticism?
Works Across All Markets and Timeframes One of the pros of technical analysis is that it can be used in a universal way. The basic ideas and concepts are the same for stocks, foreign exchange, crypto, commodities, and even sometimes for art and real estate.
Provides Clear Entry/Exit Signals In contrast to fundamental analysis, which may tell you that a certain stock is undervalued without telling you when to buy it, technical analysis provides clear levels for entry and exit prices.
Helps Identify Trends Early Strong technical analysis is often able to detect a change of trend early, allowing the entry of a trade after the start of significant movement.
Applicable to Any Trading Style If you are a short-term trader, i.e., you are involved in short-term trading asa long-term investor, technical analysis teaches us how to uncover hidden surprises in your selected period.
Visual and Easy to Understand The charm of sthe waggering process of past charts was intensified and compounded by the heaps of text and patterns of classifications.
Can Be Automated The use of technical indicators is via mathematical formulas that are made to be programmed into trading systems. This consequently leads to algorithmic and automated trading.
Short-Term Trading Friendly For traders interested in gaining from short-term moves, technical analysis has gained elemental importance since fundamental input does not change each day.
Honesty means admitting to the shortcomings of the other person.
elf-Fulfilling Prophecy Effect It can be said that technical analysis is predicting the future and creating it at the same time. When numerous traders are monitoring the same levels, the united actions of the traders can bring about the anticipated outcome.
Subjectivity in Pattern Recognition What I consider a head and shoulders pattern, you could interpret as just a normal correction. The identification of patterns includes a degree of subjectivity, resulting in different understandings.
Doesn't Account for Fundamentals Technical analysis totally disregards company financials. A stock may have a good technical picture but actually be on the verge of bankruptcy. This is the reason why it is sensible to apply technical analysis together with fundamental research. In-depth fundamentals of stock analysis, sources such as Dhanarthi.com give the financial background that cannot be provided by charts only.
False Signals and Whipsaws Not every signal is reliable. The markets frequently produce fake breakouts and reversals. One of the drawbacks of technical analysis is the occurrence of losing trades, which cannot be avoided even with ideal execution.
Works Better in Liquid Markets Technical analysis will give the best results in the most liquid markets, where there is a large number of traders taking part in the process. In the case of stocks with low trading volumes, big block orders can change the patterns formed by the market.
Past Performance Doesn't Guarantee Future Results A long-standing trading pattern that has been successful 80% of the time in the past might still not apply to your next deal. The markets are different now,w and no past success will be able to assure you of performance in the future.
Lagging Indicators Delay Signals The majority of indicators have their basis in past prices; hence, they are to some extent lagging. In the moment an indicator validates a trend, you are too late to partake in the first move.
Can't Predict Black Swan Events The technical analysis method is incapable of predicting unexpected events, such as wars, pandemics, regulatory changes, or company scandals. The occurrence of these events can immediately render technical patterns invalid.
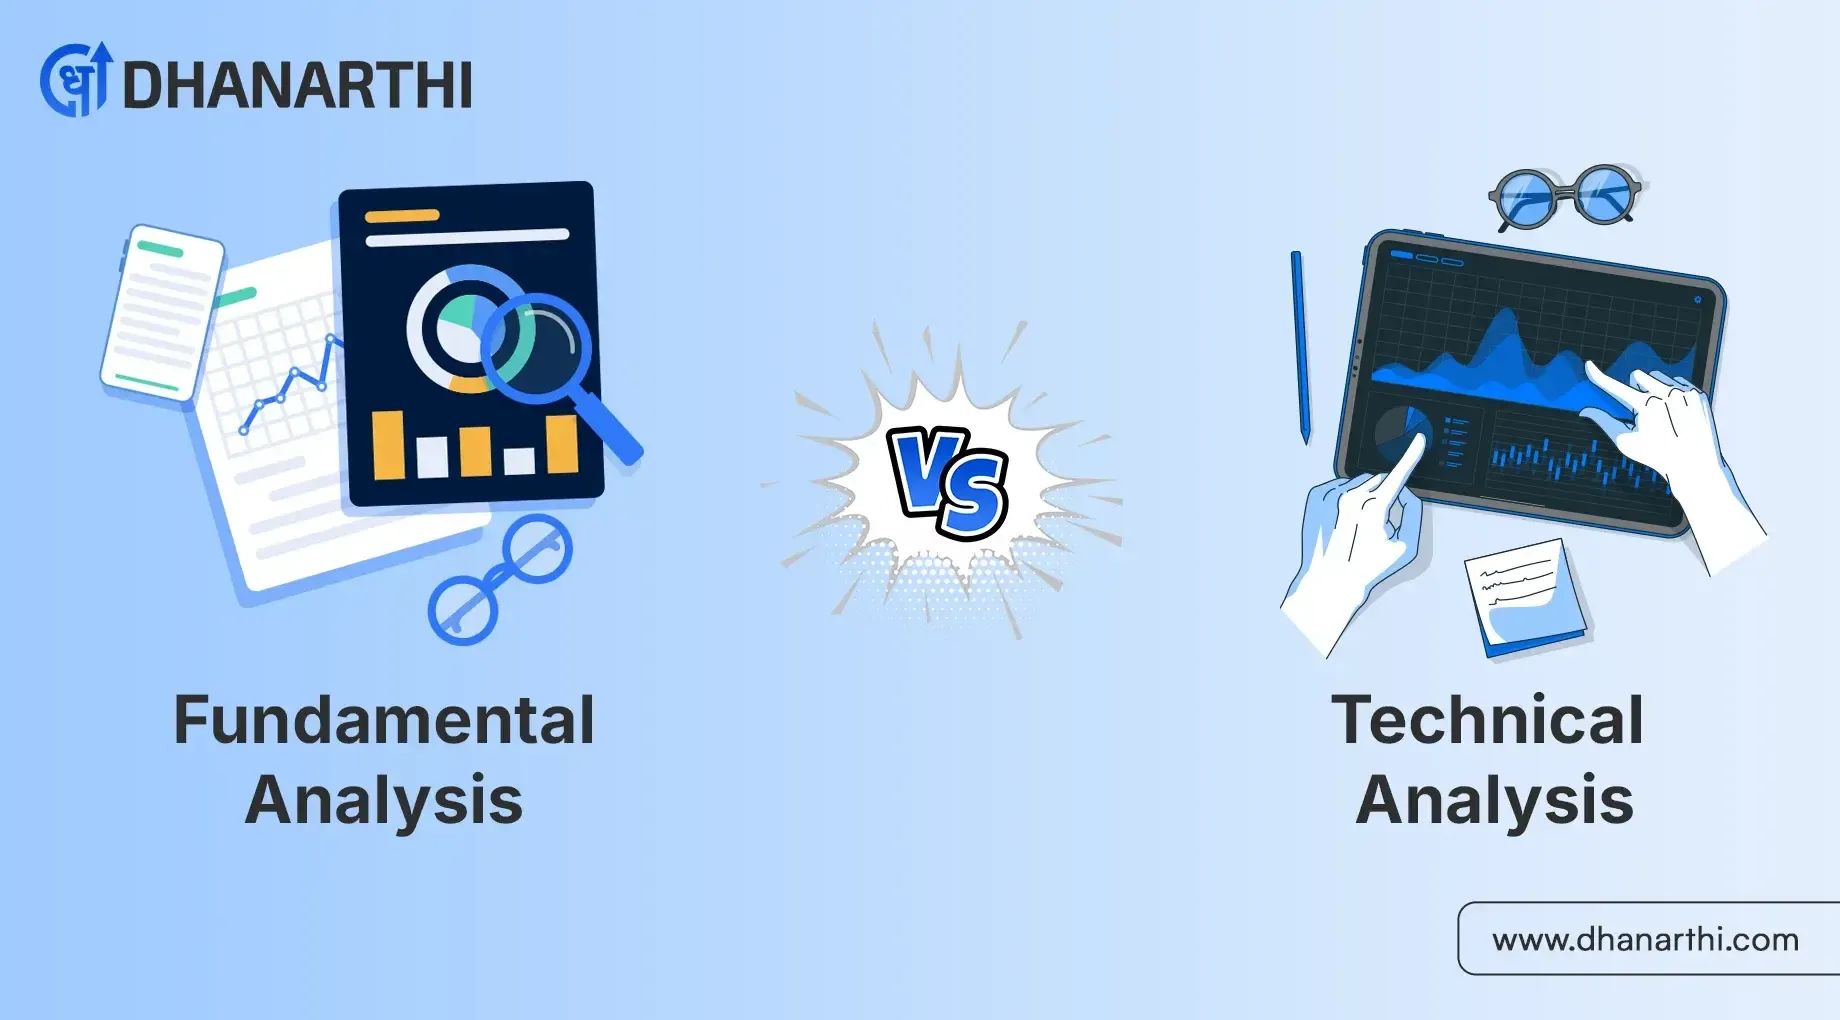
A lot of novices are pondering which approach is better. As a fact, both are worth considering.
The difference between fundamental analysis and technical analysis is very simple. It is based on what each one is examining and on their time horizons.
Fundamental analysis scrutinizes a company's financial statements, the whole industry, competition, and management. It is concerned with intrinsic value, hence, asks the question “What is the worth of this stock?” The line of thinking is that intrinsic value must be there regardless of current price.
Technical analysis looks into price charts, patterns, volume, and various indicators. It is concerned with market behavior, hence, asks the question “What will be the next price movement?” The focus is on market behavior, which is not dependent on the underlying value.
I apply fundamental analysis as my first criterion for deciding the stocks that will be placed on my watchlist. Financially sound companies, increasing revenues, competitive advantages, and fairly priced stocks go to the top of my list.
After that, I take the help of technical analysis to decide on the entry point. Even the best companies can experience a fall in their stock prices. If a technical analysis indicates that the stock might first drop to ₹900, then why buy it at ₹1000?
In day trading and swing trading,g where the position is held for a few days or weeks, the technical analysis is solely relied upon as the fundamentals do not change that quickly.
In the case of long-term investing, you will have to wait for years, and less importance is given to fundamentals. Nonetheless, technical analysis is still of great help in deciding the entry price.
The investors that I consider as the most successful ones invariably mix the two methodologies. They first interpret financial statements and other factors related to companies to determine their intrinsic worth, and then they resort to market indicators and price patterns to make the most advantageous up or down movements in the market.
To illustrate, you can screen for fundamentally strong companies using fundamental stock analysis websites in India, and afterwards, when those stocks are down to support levels, carry out technical analysis of stocks to recognize the best entry points.
Day traders and scalpers base their operations predominantly on technical analysis as they do not stay in a position for such a long time that the fundamentals could have an impact.
Swing traders employ both methods but give technical analysis preference for the timing of trades that last from a few days to weeks.
Position traders mix both approaches almost evenly, relying on fundamentals to choose stocks and technical analysis for timing.
Long-term investors mainly consider fundamentals like P/E ratio, growth prospects, and competitive advantages, but by using technical analysis for better entry and exit timing, they can increase their returns significantly.
In technical analysis, it is not necessary to master every single indicator or pattern to win. Simplicity, trade plan following, and gaining experience from each trade you make are the factors that matter. Charts become more and more familiar to you as you practice, and thus your confidence increases. In the end, patience and consistency are usually more effective than complicated strategies. The right support and tools definitely ease the learning curve significantly.
Dhanarthi is the solution to that problem. It is a platform that combines learning, analysis, and practical application of trading concepts. With Dhanarthi's stock screener and comprehensive analysis tools, you can remain focused, improve daily, and grow gradually. Whether you're performing technical analysis or fundamental research, having the right platform makes all the difference.
Disclaimer: This analysis is for educational purposes and not financial advice. Please consult a financial advisor before making investment decisions.
1. What is the difference between fundamental analysis and technical analysis?
Fundamental analysis looks at a company's financial health, earnings, and intrinsic value to decide if a stock is worth buying. Technical analysis studies price charts, patterns, and volume to predict future price movements. Fundamental focuses on what to buy, while technical helps decide when to buy it.
2. What are the main assumptions of technical analysis?
Technical analysis works on three key ideas: first, market prices already include all available information; second, prices move in trends that can be identified; and third, history repeats itself because human emotions like fear and greed create similar patterns over time in the market.
3. What is a bar chart in technical analysis and how does it work?
A bar chart shows four price points for each trading period using vertical lines. The top represents the highest price, bottom shows the lowest, a left tick marks the opening price, and a right tick shows closing price. This format gives traders more information than simple line charts.
4. What are the main limitations of technical analysis?
Technical analysis can't predict unexpected events like wars or company scandals. It's subjective, meaning different traders may see different patterns in the same chart. False signals are common, indicators lag behind price movements, and it doesn't consider company fundamentals or real business value at all.
5. What are the key advantages of technical analysis for traders?
Technical analysis works across all markets and timeframes, making it highly flexible. It provides clear entry and exit signals, helps spot trends early, and is visual and easy to understand. You can automate trading strategies based on technical indicators, making it perfect for short-term trading styles.
6. What is technical research in the context of stock markets?
Technical research involves studying price movements, volume data, and market patterns to forecast future price direction. Traders use charts, indicators like RSI and MACD, and historical patterns to make informed trading decisions. It's based on the belief that price action reflects all market information.
7. What are the core principles of technical analysis?
The three core principles are: market prices discount everything, meaning all information is already reflected in the price; prices move in identifiable trends; and history repeats itself due to consistent human psychology. These principles form the foundation for all technical analysis strategies and methods.
8. How do you perform technical analysis of stocks step by step?
Start by identifying the overall trend using daily or weekly charts. Mark key support and resistance levels where prices historically reversed. Look for chart patterns like triangles or flags. Apply indicators like MACD and RSI for confirmation. Check volume, set entry and exit points with stop-losses.
9. What is stock market technical analysis used for?
Stock market technical analysis helps traders time their entries and exits by studying price charts and patterns. It's used to identify trends, predict reversals, manage risk with stop-losses, and find profitable trading opportunities. Both short-term traders and long-term investors use it for better timing.
10. What are the best platforms for technical analysis of stocks available in India?
TradingView is popular for its user-friendly interface and social features. Zerodha Kite offers excellent charting tools for Indian markets. Upstox Pro provides advanced indicators. TradingView works across all markets, while platforms like Kite and Upstox are specifically designed for Indian stock trading needs.
11. Which mobile apps offer advanced technical analysis tools for Indian stock markets?
Zerodha Kite mobile app provides comprehensive charting and indicators. Upstox Pro mobile offers real-time analysis tools. TradingView mobile app has drawing tools and alerts. Groww and Angel One apps also include basic technical indicators, making it convenient for traders to analyze stocks on the go.
12. Can you recommend software for automated technical analysis in cryptocurrency trading?
TradingView supports crypto markets with Pine Script for automation. MetaTrader 5 works for crypto CFDs with algorithmic trading capabilities. Binance and WazirX platforms offer API access for automated strategies. However, test strategies thoroughly before risking real money, as crypto markets are highly volatile.
13. Where can I find tutorials on using technical indicators like RSI and MACD effectively?
YouTube channels like Zerodha Varsity, TradingView's education section, and platforms like Dhanarthi offer free tutorials. Investopedia provides detailed explanations. Many brokers include educational resources in their platforms. Practice on demo accounts first to understand how RSI and MACD signals work in real market conditions.
14. What are the top charting tools for technical analysis with live Indian market data?
Zerodha Kite offers real-time NSE and BSE data with excellent charting. TradingView provides live data through broker integrations. ChartInk is popular for scanning Indian stocks. Upstox Pro and Angel One platforms also provide live charting. Most require active trading accounts for real-time market data access.
15. How to choose a reliable technical analysis platform for intraday trading in India?
Look for platforms with real-time data, fast order execution, and customizable charts. Check if they offer essential indicators like RSI, MACD, and Bollinger Bands. Consider user interface simplicity, mobile app availability, and customer support. Compare brokerage charges and ensure the platform has minimal downtime during trading hours.
Share Market
IPO
Artificial Intelligence
Semi Conductor