





Best Banking Stocks in India 2026
October 26, 2026



TABLE OF CONTENTS
Get AI Summary





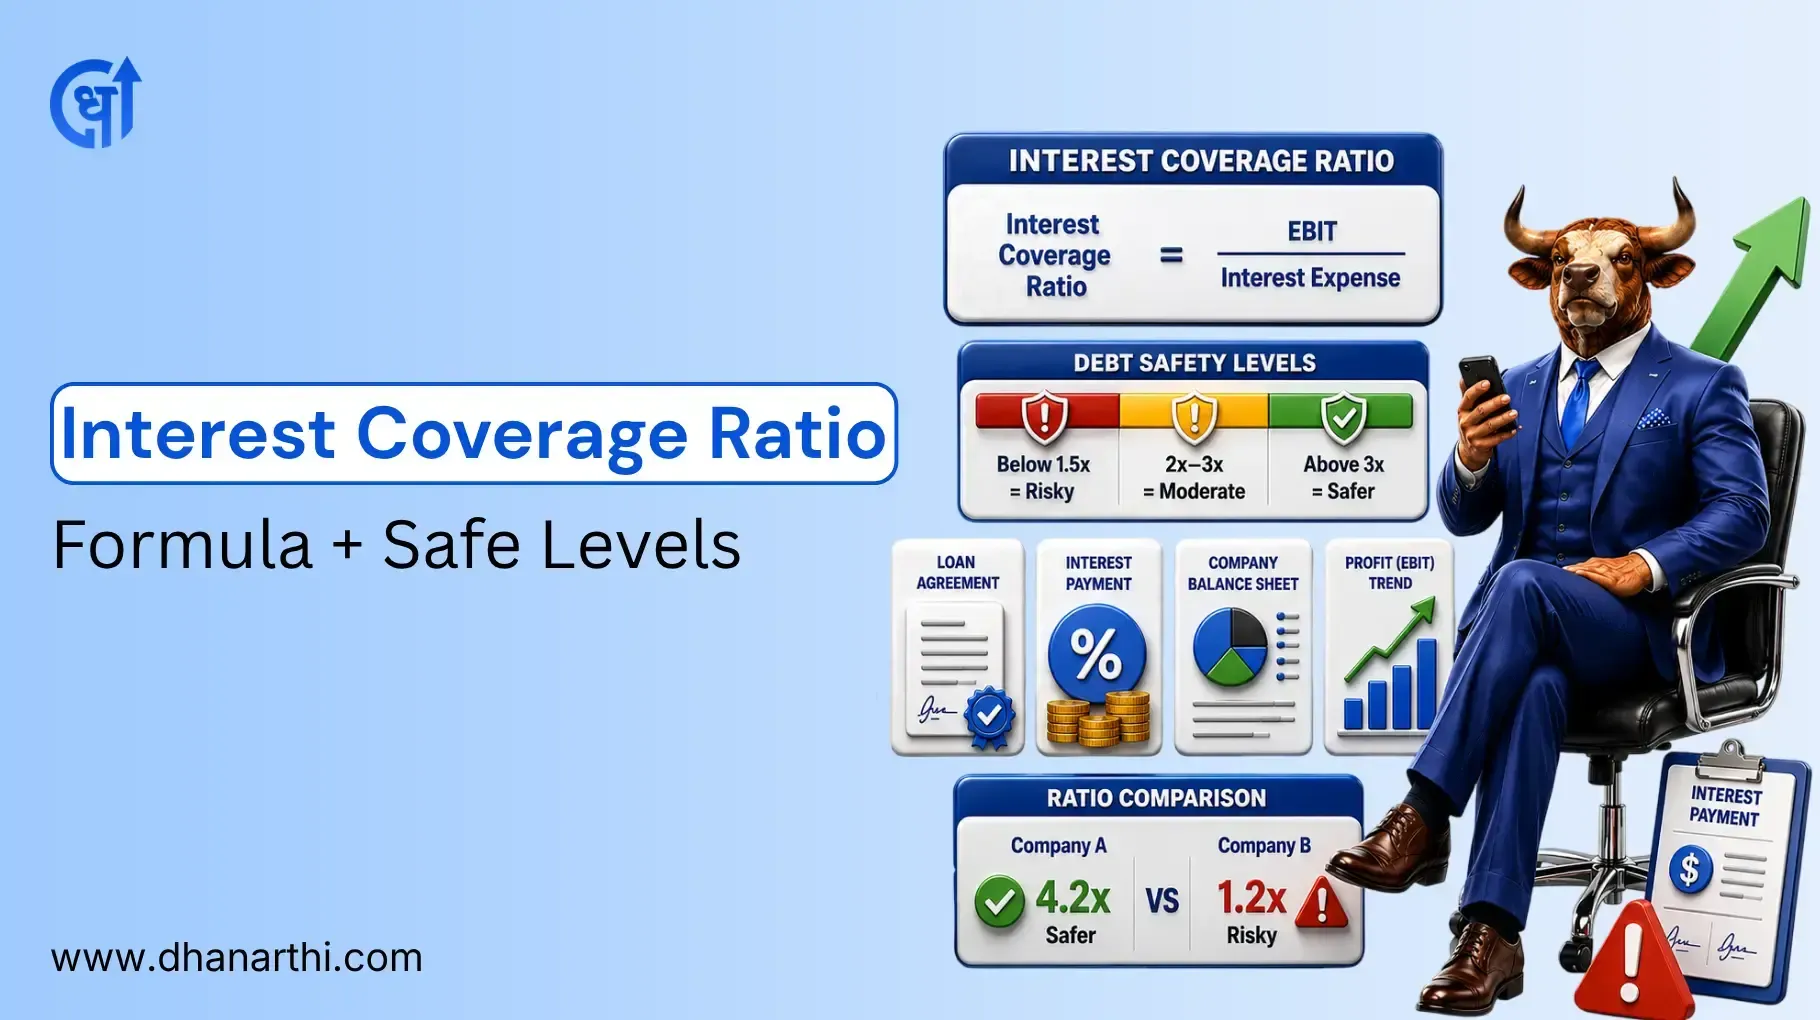
Interest Coverage Ratio shows how many times a company can cover interest costs on its debts. This financial indicator is calculated as a ratio of EBIT (Earnings Before Interest and Taxes) to Interest Expenses. If that number is 3 or higher, everything is fine, and the company can pay off its liabilities. A value below 1.5 will indicate the company’s inability to pay interest from current profits.
Interest Coverage Ratio (ICR) = EBIT ÷ Interest Expense
A ratio above 3 is generally considered comfortable; below 1.5 is a warning sign; below 1 is a red flag
Safe levels vary by sector; capital-intensive industries can run lower ICR than asset-light ones
A single weak quarter does not always mean distress; check the multi-year trend before concluding
ICR works best alongside debt-to-equity ratio for a complete leverage picture
For the full picture of how leverage shows up on a balance sheet, read financial leverage explained
ICR meaning refers to the number of times that a company can pay back its interest payments with its operating income. Various lenders, equity analysts, and credit rating agencies such as CRISIL and ICRA arrive at the interest coverage ratio as the first shortlisting criterion before analyzing the details of a company’s finances.
A firm with a high ICR will possess a robust ability to pay back its interest payments with ease even when it encounters financial hardships. However, firms with low ICR do not have such advantages, and one poor quarter can trigger defaulting of loan payments.
The standard interest coverage ratio formula is:
ICR = EBIT / Interest Expense
EBIT (Earnings Before Interest and Taxes) represents operating profit before financing costs and taxation are deducted. For Indian listed companies, EBIT is most easily derived as:
EBIT = Profit Before Tax (PBT) + Finance Costs
This shortcut works directly off the income statement line items most Indian companies report, without needing to rebuild EBIT from scratch.
JSW Steel reported interest of Rs 2168 crore in the fourth quarter ofFY2026. Further, its EBIT-to-interest coverage ratio for the same period improved to 3.98x, the best level in recent times (Source: MarketsMojo JSW Steel Q3FY2026 result highlights, May 2026).
ICR = EBIT / Interest Expense = 3.98x
| Metric | Q4 FY2026 Figure |
|---|---|
| Interest Cost | Rs 2,168 crore |
| ICR | 3.98x |
| Prior Quarter ICR (Q3 FY2026) | Lower; interest cost was Rs 2,304 crore |
Data source - Company's quarterly results on MarketsMojo. As of June 2026.
This implies that JSW Steel's operating income was more than enough to cover its quarterly interest payment by almost four times, which is a healthy coverage for a capital-intensive steel maker. To access ICR along with other debt and profitability ratios of any listed company on NSE, you may want to use this JSW Steel Limited stock analysis report as a reference while shortlisting potential stocks for investment. The stock screener pulls these figures together in one view.
There is no single perfect ICR, but general interpretation bands are widely used by Indian analysts and credit officers.
| ICR Range | Interpretation |
|---|---|
| Above 3x | Generally considered safe, comfortable debt servicing capacity |
| 1.5x to 3x | Acceptable but worth monitoring, limited cushion |
| Below 1.5x | Warning sign, earnings barely cover interest |
| Below 1x | Red flag, operating earnings cannot fully cover interest |
Most equity analysts consider NSE-listed firms with ICR below 1.5x to be at high risk because of the possibility that any slight decrease in earnings may lead to situations where interest payments surpass total earnings from operations.
A flat "above 3x" rule does not work equally across sectors. Capital-intensive industries naturally carry more debt and run lower ICR than asset-light businesses.
| Sector | Typical Safe ICR | Why |
|---|---|---|
| IT services and FMCG | 8x and above | Low debt, asset-light, predictable margins |
| Banking and NBFC | Not directly comparable | Interest is core business income, not a cost burden in the same sense |
| Auto and manufacturing | 3x to 5x | Moderate capital investment, cyclical demand |
| Steel, cement, infrastructure, power | 2x to 4x | Heavy capital expenditure, project financing, cyclical earnings |
Data sourced from sector financial filings and rating agency benchmarks. Last updated: June 2026.
An infrastructure company with an ICR of 1.8x can still carry a reasonable credit rating if its cash flows are predictable and long-term, which is why rating agencies look at multiple factors alongside ICR rather than this ratio in isolation.
JSW Steel's average interest coverage was 3.20x in FY2026, while the debt-to-EBITDA ratio was 3.29x, indicating moderate but acceptable leverage for a steel producer with an aggressive capacity expansion program (Source: MarketsMojo, May 2026).
| Company | Sector | ICR | Reading |
|---|---|---|---|
| JSW Steel (FY2026 average) | Steel manufacturing | 3.20x | Adequate for a capital-intensive cyclical sector |
| Hypothetical stressed peer | Capital-intensive | Below 1x | Earnings insufficient to cover interest, high default risk |
A firm trading at more than 3 times in an industry that typically trades between 2 and 4 times is a good candidate for value investors given the heavy investment in capital assets required to generate returns. On the other hand, a company with a price-to-cash ratio of below 1 in the same industry is a bad omen and should be investigated further before any investment decisions are made.
A common mistake made by investors is to interpret any given set of weak numbers from a company as a sign of distress for the business. JSW Steel’s quarterly ICR (interest coverage ratio) improved from a relatively low value in Q3 FY2026 to 3.98x for Q4 FY2026 due to one-time exceptional gains in profit before tax, not any fundamental improvement in the underlying business conditions (Source: MarketsMojo, May 2026)
Single quarter surprises, driven by one-time gains or expenses, or seasonal variations in revenues or costs, should not be used to predict long-term distress. A meaningful fall in the ICR that lasts for multiple quarters while revenues or margins are also under pressure is a more reliable indicator of financial distress. Always look at trends of 3-4 quarters or more and evaluate in conjunction with changes in revenue or margin.s
ICR, however, has its limitations; it can be misleading as far as overstatement in some cases.
EBIT is an accounting income and not cash flows; therefore, even if a firm looks good according to the ICR, there might be no actual cash available for the payment of dividends or debts (Carter & Usry, 2015).
This ratio does not account for the principal repayment in the determination of the ability of the firm to pay its debts; it only considers the interest. Some leases, especially for aircraft and retail, are off-balance-sheet obligations and, therefore, distort the ratio (Carter & Usry, 2015).
When analyzing the leverage of a firm, the Debt-Equity ratio should always be considered in conjunction with ICR. Unlike the latter, the Debt-to-Equity ratio considers the total amount of debt as a percentage of equity in order to determine athe abilityto pay back debts.
Use ICR as one filter among several when screening debt-heavy companies.
Check ICR over at least 3 to 4 years, not a single period
Compare against sector-specific safe levels, not a flat universal number
Cross-check with debt-to-equity ratio to see the full leverage picture
Watch for sudden ICR jumps from one-off gains rather than genuine operating improvement
Treat ICR below 1.5x as a signal to dig deeper into cash flow and debt maturity schedule before investing
Interest coverage ratio provides a snapshot of the company’s ability to service its debt with ease from its operating income. However, it is important to set the benchmark based on the industry and evaluate it over several quarters instead of relying on a singular figure.
It is best to pair the coverage ratios with debt-to-equity and cash flow analysis to evaluate whether a leveraged stock is a worthy investment or not.
Disclaimer: This article is for educational purposes only. It does not constitute investment advice. Please consult a SEBI-registered financial advisor before making investment decisions.
1. What is Interest Coverage Ratio?
Interest Coverage Ratio measures how easily a company can pay interest on its debt using operating earnings. It is calculated as EBIT divided by Interest Expense.
2. What is the interest coverage ratio formula?
ICR = EBIT / Interest Expense. EBIT can also be calculated as Profit Before Tax plus Finance Costs, which is convenient for Indian listed company financials.
3. What is a good interest coverage ratio?
A ratio above 3 is generally considered safe. Below 1.5 is a warning sign, and below 1 means operating earnings cannot fully cover interest payments.
4. What does ICR below 1 mean?
It means the company's operating earnings are insufficient to cover even one year of interest expense, forcing reliance on cash reserves or additional borrowing.
5. Does a good interest coverage ratio vary by sector?
Yes. Asset-light sectors like IT and FMCG typically run ICR of 8x or higher, while capital-intensive sectors like steel and infrastructure can be considered safe in the 2x to 4x range.
6. Is a higher interest coverage ratio always better?
Generally yes, but an extremely high ICR alongside very low debt may also mean a company is underutilising leverage to fund growth, which is not necessarily optimal for shareholders.
7. Can interest coverage ratio be negative?
Yes, when EBIT itself is negative, meaning the company is operating at a loss before interest and taxes. A negative ICR signals serious financial stress.
8. Does a falling ICR always mean financial distress?
Not always. A single quarter's decline can come from one-off items or seasonal factors. Genuine distress typically shows up as a sustained multi-quarter decline alongside falling revenue.
9. What is the difference between ICR and Debt Service Coverage Ratio (DSCR)?
ICR measures only interest payment capacity. DSCR is broader and includes both interest and principal repayment, making it the stricter measure used by banks for term loan assessment.
10. How is EBIT calculated from Indian company financial statements?
The fastest method is EBIT = Profit Before Tax (PBT) + Finance Costs, both of which are directly reported line items in Indian listed company income statements.
Share Market
IPO
Artificial Intelligence
Semi Conductor