
Moat Analysis: Finding Stocks with Competitive Advantage
July 13, 2026



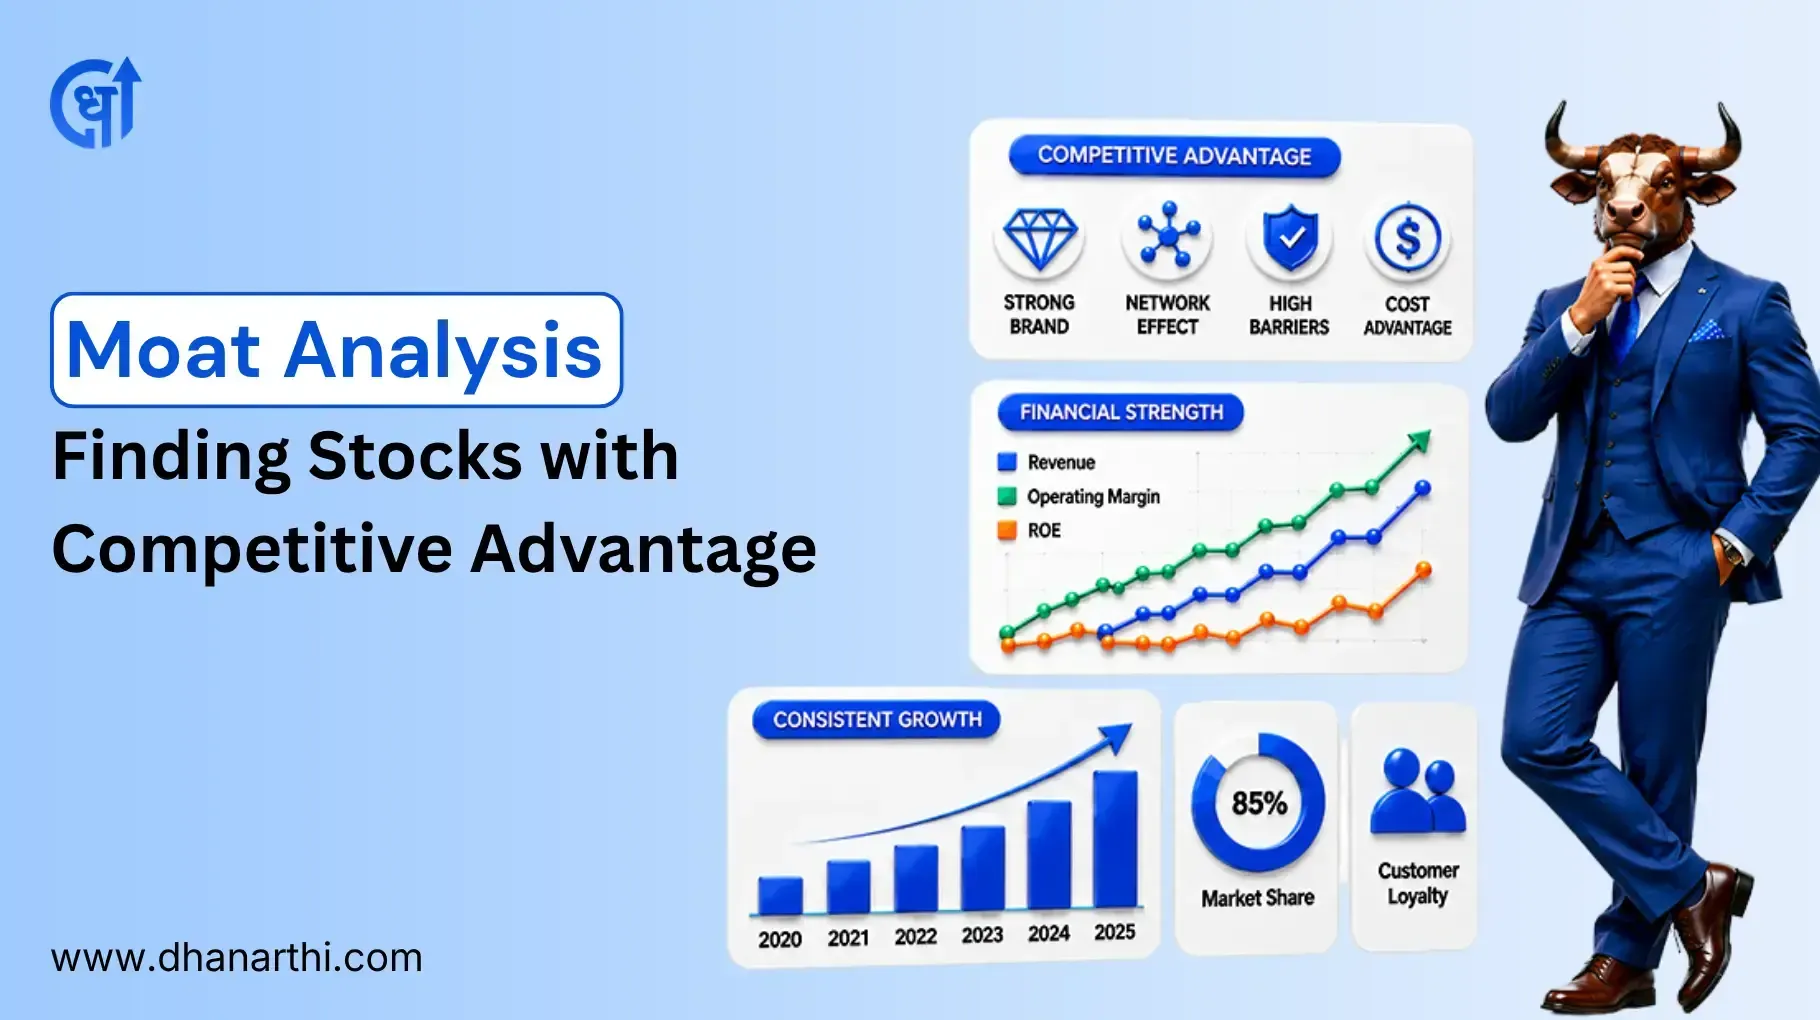
TABLE OF CONTENTS
Get an AI Summary of This Post Using The Tools Below.





Moat analysis is the process of assessing the company’s ability to protect its competitive advantages from being overtaken by competitors and eroded over time in order to ensure continual generation of economic profit. In other words, a company with a moat is characterized by consistently increasing return on equity, return on capital employed of over 20%, and power to raise prices even when the whole economy is going through a down cycle.
The problem with focusing on the short-term price of a stock is that it ignores the question of the business's competitiveness over a decade. The moat analysis helps evaluate if the company's position will enable it to avoid being undercut by competitors in the future. A financial ratios analysis provides insight into the current state of the firm's operations and performance.
Five main moat types: cost advantage, brand, switching cost, network effect, and regulatory
Sustained ROE and ROCE above 20 percent over 5 years is the first screening filter
Pricing power without volume loss is direct proof of a moat, not an assumption
Even strong moats can erode from disruption, new entrants, or governance failure
A moat protects the business, not the stock price, so valuation still matters
The moat definition was introduced by Warren Buffett, who compared good business to a castle with a moat around it. In investing, a moat refers to a protective barrier against competitors and signifies that the business will not lose its market share or ability to make profits over time, despite numerous attempts to take it down.
Moat full form in informal language simply states an economic moat, which was a phrase coined by Warren Buffett in the late 90s, to describe a lasting competitive advantage, as opposed to a temporary one, which a business acquires over its product or service.
A moat is definitely not a synonym for a good year or even a couple of years. Even the most successful company can experience a period of prosperity, which can last for two years, after which its market share can be significantly eroded away because of a price war initiated by a bigger competitor.
Each moat type protects profit in a different way. Some rely on cost structure, others on customer behavior or government rules.
| Moat Type | How It Protects Profit | Indian Example |
|---|---|---|
| Cost Advantage | Lower production or distribution cost than rivals, allowing profit even at lower prices | Avenue Supermarts (DMart) runs a low-cost, bulk-procurement model that competitors struggle to match |
| Brand | Customers pay a premium and stay loyal due to trust | Titan commands pricing power in jewellery and watches through the Tanishq brand |
| Switching Cost | Customers face inconvenience or risk in moving to a competitor | Enterprise software and core banking systems, where migration disrupts operations |
| Network Effect | Product value rises as more users join, making late entrants uncompetitive | Payment and exchange platforms that gain liquidity as usage grows |
| Regulatory | Licenses or approvals limit new entrants | CDSL holds one of only two depository licenses in India, alongside NSDL |
Data sourced from company disclosures and Screener.in ratio data. Last updated: July 2026.
A competitive advantage is any advantage that a company has over its competitors currently. This can be something as simple as a new product or even simply a reduction in costs. A moat, on the other hand, is a competitive advantage that is durable. It is resistant to competition, and it lasts for long periods of time. In other words, every moat is a competitive advantage, but not all competitive advantages are moats.
Moat analysis works best as a checklist run against real numbers, not a qualitative impression of brand strength.
Step 1: Check long-term ROE and ROCE.
A company that has a good moat typically delivers returns on equity (ROE) and returns on capital employed (ROCE) of over 20% for an extended period of time. Hindustan Unilever, for instance, has a ROCE of 28.4% and a ROE of 31%. (Source: Screener.in, based on BSE filings, July 2026). CDSL, on the other hand, has delivered a three-year average ROE of 29.2%. (Source: Screener.in, July 2026). This is significantly higher than most of the financial services companies in India can typically manage.
Step 2: Track margin stability, not margin size
A moat shows up as margins that hold steady through input cost swings, not just high margins in one good year.
Step 3: Confirm the balance sheet supports the moat.
Businesses with a real moat rarely need heavy borrowing to defend market share. Check debt-to-equity and interest coverage using ROE vs ROCE as your starting filter before layering in balance sheet checks.
Step 4: Look at market share trend over 5 years, not 1 year.
A moat should show stable or rising share, not just a stable position in a single data point.
Step 5: Test pricing power directly.
Ask whether the company raised prices in the last 2 years without losing volume. If yes, that is direct evidence of a moat rather than an assumption.
| Company | Moat Type | ROE | ROCE |
|---|---|---|---|
| Hindustan Unilever | Brand + Distribution | 31.0% | 28.4% |
| CDSL | Regulatory (Duopoly) | 23.0% (TTM) | Not disclosed separately |
| Titan | Brand + Switching Cost | 25.2% | 18.7% |
Data is taken from Screener.in using the files submitted on BSE and NSE. As of July 2026.
CDSL income dropped from 526 crore to 455 crore in FY26 despite having one of the two depository licenses in that segment (Source: BSE filings data complied by 5paisa as of July 2026). So, next time someone sells you the idea that a moat creates profits, remind them that profits are for shareholders, while the moat is for protection, and ask them to separate the two while analyzing a stock with a moat.
Moats do not disappear overnight, but they weaken in visible steps. Watch for these signals in Indian markets specifically.
Signs of moat erosion can take many forms. Here are three indirect "smell tests" that can help identify potential issues:
Margin compression across a full sector: Persistent compression of profit margins in an entire sector due to rising labor costs and price competition indicates a weakness in the industry's cost structure, suggesting that switching costs previously thought to be "moats" in that sector may not be as significant as believed.
A respected institution witnessing loss of depositor/customer confidence: The near-collapse of Yes Bank in 2020 demonstrated that even banks with implicit government guarantees as a "moat" can experience a rapid loss of depositor confidence when asset quality concerns arise, damaging the bank's reputation.
New entrants targeting a pricing model: Asian Paints' recent experience with value segment pricing pressures following the 2025 entry of new conglomerate-backed competitors serves as a cautionary tale for their ROCE leadership strategy. With an ROCE of over 30% versus industry averages of 22%, Asian Paints' management has a strong incentive to defend its premium pricing position (per our analysis of FY25 disclosures in MatrixBCG).
One data point of this type is not necessarily cause for alarm, but multiple such observations across different areas of the business merit further investigation.
Moat analysis is best applied as a filter to be used on top of more traditional fundamental screening. First, apply standard fundamental screening tests, then subject those that pass to the moat criteria outlined above. By doing this, you can narrow your short list to those companies most worthy of your time for a detailed reading of the annual report and concall transcripts. For an introduction to other fundamental screening criteria, see how to analyse a stock for investment.
A wide moat does not always provide good value on the stock, especially if it is overvalued. Often moat companies have high valuations, and high valuations kill returns, even for great businesses.
Moats can also be destroyed by changes in regulations or to technology, or poor management decisions not anticipated by any financial analysis. The analysis of moats in this article is intended to be used as one tool in your investment research, rather than an end in itself.
This article is just for information purposes and should not be considered investment advice. Please consult a SEBI-registered investment advisor before taking any decision
Moat analysis transforms the question from 'is the stock going to go up' to 'can the company defend its profits for the next 10 years"
Before falling for the brand name, run the moat test (ROE, ROCE, margin stability, debt, and pricing power), and do it again every year because even the mightiest moats (Asian Paints) can encounter new challenges.
Used together with fundamental screening, moat analysis helps separate 'wealth generators' from 'one-trick ponies'
**Disclaimer:**This article is for educational purposes only and does not constitute financial advice. Please consult a SEBI-registered advisor before investing.
1. What is moat analysis in the stock market?
Moat analysis is the process of judging whether a company holds a durable competitive advantage that protects its profits from rivals over the long term. It goes beyond a single year of good results to test staying power.
2. What is the moat full form?
Moat does not have a technical full form. It is used directly as the term "economic moat," borrowed from the idea of a castle protected by a water-filled trench.
3. What are the main types of economic moats?
The five widely used types are cost advantage, brand, switching cost, network effect, and regulatory moat. Most durable Indian companies rely on a combination of two or more.
4. How do I identify moat stocks in India?
Check for sustained ROE and ROCE above 20 percent over 5 years, stable margins through cost cycles, low debt reliance, and pricing power shown through price hikes without volume loss.
5. Is ROE alone enough to confirm a moat?
No. High ROE can also come from high debt or a temporary favorable cycle. Pair ROE with ROCE, margin stability, and market share trends for a fuller picture.
6. What is the difference between moat analysis and competitive advantage?
A competitive advantage is any current edge a company has. A moat is a competitive advantage proven to survive sustained competition over many years.
7. Can a company lose its moat?
Yes. Nokia and BlackBerry lost brand and switching-cost moats to smartphones globally. In India, margin pressure across IT services and Yes Bank's 2020 trust collapse show moats can weaken through disruption or governance failure.
8. Which Indian companies are commonly cited as having strong moats?
Hindustan Unilever, CDSL, Titan, and Asian Paints are frequently cited due to sustained high ROE, ROCE, and pricing power, though each faces its own emerging risks.
9. Does a moat guarantee good stock returns?
No. A moat protects the underlying business, not the stock price. Overpaying for a moat company can still produce weak returns.
10. How often should I re-check moat analysis on a stock I hold?
Review moat signals at least once a year alongside annual report analysis, and sooner if a sector faces new regulation, a major new entrant, or a technology shift.
Share Market
IPO
Artificial Intelligence
Semi Conductor