


EPS in the Stock Market: Meaning, Formula and Importance
June 15, 2026

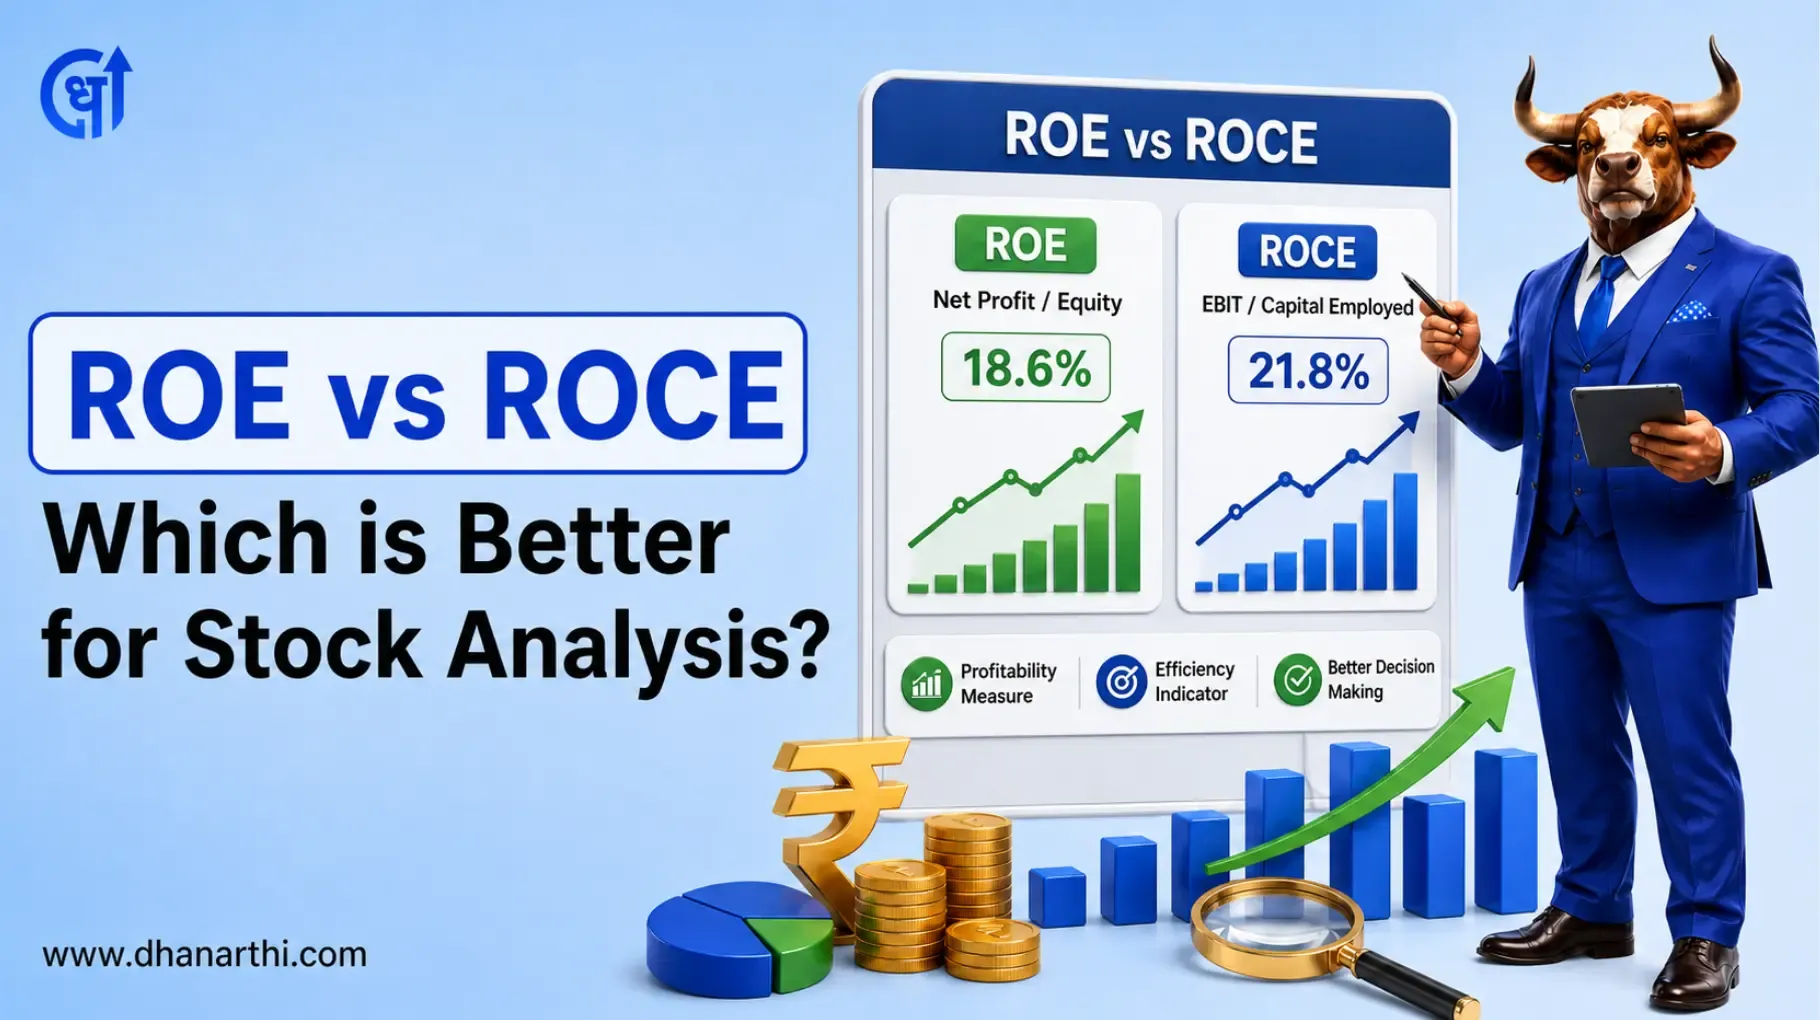
TABLE OF CONTENTS
Get an AI Summary of This Post Using The Tools Below.


ROE vs ROCE are both profitability ratios, but they measure different things. ROE (Return on Equity) measures profit earned per rupee of shareholders' equity.
ROCE (Return on Capital Employed) measures profit earned per rupee of all capital used, including debt. For capital-intensive businesses, ROCE is more reliable. For asset-light companies, both ratios together give the complete picture.
The difference is almost always debt. That is the core reason why understanding financial ratio analysis goes beyond a single number.
This article covers what ROE and ROCE each measure, how to calculate them using real Indian company data, sector-wise benchmarks, and a 3-step framework to use both ratios together when picking stocks.
ROE indicates how many dollars of net profit a company earns per dollar of shareholders’ investment. Higher ROE shows that the company is making more profits on its shareholder investments.
Formula:
ROE = (Net Profit / Shareholders' Equity) x 100
Net Profit: Profit after paying all expenses, taxes, and interest (from the income statement)
Shareholders' Equity: Total assets minus total liabilities (from the balance sheet)
Real Example: TCS FY25:
TCS reported a net profit of Rs 48,553 crore and shareholders' equity of approximately Rs 94,282 crore in FY25.
ROE = (48,553 / 94,282) x 100 = 51.5%
This means TCS earned Rs 51.50 for every Rs 100 of equity shareholders invested. TCS carries almost no debt, which makes this ROE a genuine signal of business quality, not a leverage effect (Source: BSE filing, FY25).
Benchmark: ROE above 15% held consistently over 5 years is a positive signal for Indian stocks. ROE above 20% indicates strong management efficiency.
ROCE shows how effectively an enterprise utilises all of its capital, both equity and loan capital, in order to earn income from operations. The difference between ROE and ROCE is that ROCE considers EBIT, or earnings before interest and tax.
Formula:
ROCE = (EBIT / Capital Employed) x 100
EBIT: Operating profit before interest and tax payments
Capital Employed: Total Assets minus Current Liabilities
Real Example: HDFC Bank FY25:
HDFC Bank reported a ROCE of 13.22% in FY25, down from 15.15% in FY24. Its ROE for the same period stood at 13.7% (Source: BSE filing, FY25).
For a bank with a large asset base and significant borrowings, ROCE and ROE being close to each other indicates that leverage is not artificially inflating returns. The slight divergence signals the impact of the HDFC-HDFC Bank merger normalising over FY25.
Benchmark: ROCE above 15% is considered healthy in most Indian sectors. In capital-intensive sectors like infrastructure, a consistent ROCE above 12% is acceptable.
| Parameter | ROE | ROCE |
|---|---|---|
| What it measures | Returns on shareholders' equity | Returns on total capital (equity + debt) |
| Formula | Net Profit / Shareholders' Equity | EBIT / Capital Employed |
| Profit metric used | Net Profit (after interest, tax) | EBIT (before interest, tax) |
| Includes debt? | No | Yes |
| Best used for | Asset-light companies; low-debt businesses | Capital-intensive businesses: comparing companies with different debt levels |
| Key limitation | Can be inflated by high debt | Does not reflect shareholder-specific returns |
What Do ROE and ROCE Numbers Actually Tell You?
The real insight comes not from reading each ratio in isolation, but from comparing the two together.
This is an indication of alarm bells ringing. Any firm that shows ROE at 28 per cent while ROCE is at only 1 per cent definitely carries huge debts. The reason being that it reduces taxable income due to increased interest charges. Check the debt-to-equity ratio before trusting this ROE figure.
This represents true business quality. For TCS in FY25, ROE stood at 51.5%, and ROCE was about 68%. Both of these are very high figures, and both of them are close in context to the almost negligible levels of debt of the firm. In the case of a firm with negligible debt, similar ROE and ROCE indicate true profits.
Although ROCE may exceed 15% as an absolute measure, it becomes a warning signal for the company if there has been a declining ROCE pattern. This indicates that the company has invested heavily but earned less return on each rupee invested.
What counts as "good" varies by sector. A 15% ROCE in infrastructure is strong. The same 15% ROCE in FMCG suggests the company is underperforming its peers.
| Sector | Good ROE (%) | Good ROCE (%) | Reason |
|---|---|---|---|
| FMCG | 25-40%+ | 30-50%+ | Asset-light, high brand power, low working capital cycle |
| IT Services | 25-55%+ | 30-70%+ | Near-zero debt, high margins, minimal fixed assets |
| Private Banking | 12-18% | 10-16% | Capital-heavy; ROE and ROCE naturally lower; compare within sector |
| Infrastructure / Capital Goods | 10-16% | 12-18% | High capex, long asset life; consistency matters more than peak |
| Metals / Steel | 10-20% | 10-18% | Cyclical; compare over the full business cycle, not one year |
| Pharma | 15-25% | 18-28% | R&D-heavy; ROCE improves as products scale |
Data sourced from NSE/BSE sector filings and AMFI reports. Last updated: June 2026.
Key rule: Always compare ROE and ROCE within the same sector. Never benchmark a steel company's ROCE against an IT company's ROCE.
This is the most critical usage of ROCE that retail investors fail to understand.
All companies have a cost of obtaining funds. Banks levy an interest rate on borrowed money. There is an expectation from shareholders. This weighted cost is termed WACC (Weighted Average Cost of Capital).
The rule: If ROCE is below WACC, the company is destroying value even if it is showing a paper profit.
Example:
A company with a total capital of Rs 500 crore earns EBIT of Rs 35 crore.
ROCE = 35 / 500 = 7%
If the average cost of capital for the same company is 9.5%, and stockholders demand more than 12%, then the WACC would be around 10%-11%. If ROCE is at 7%, that means the rupee being invested is earning less than what it costs to earn it.
ROCE trending downward over 3+ years while debt levels are rising
ROCE below 10% in a sector where the cost of debt itself is 9-10%
Operating profit is growing slowly, while capital employed grows fast
This pattern appeared in several Indian infrastructure companies during 2011-2016 before their debt restructuring cycles. Tracking ROCE vs borrowing cost is a key pre-screening step.
However, there is an inherent flaw in ROE in India that has something to do with PSU (Public Sector Undertakings) in the country.
Most of the big PSUs in India, such as Coal India, NTPC, ONGC, and Power Grid,d have excess equity in their books as a result of retained earnings, investment from the government, and mandatory reserves.
The coal company recorded a net profit of Rs 33,121 crore in the fiscal year 25,5, with shareholders’ equity being about Rs 37,000 crore, giving the company a Return on Equity (ROE) ratio of close to 27%, which appears to be quite impressive. On closer scrutiny, however, one notes that the Coal India price mechanism is regulated by the government, the company’s capital expenditures are low, and its retained earnings are unusually high. The use of Return on Capital Employed (R, therefore,e helps eliminate some distortions.
About Public Sector Undertaking (PSU) stocks, a declining ROE does not necessarily reflect poorly on the stock. It simply means that the company is earning more but retaining the same without utilising the earnings.
Also note for banking stocks: Standard ROCE is not the right metric for banks and NBFCs. For financial sector companies, Return on Assets (ROA) and ROE are more relevant. ROCE becomes less meaningful when the business model itself is built on debt intermediation.
This framework works for any stock across any NSE or BSE-listed sector.
Pull up the company's last 5 annual reports or screener data. If ROCE has stayed above 15% across different market cycles, this signals durable capital efficiency. A single-year spike is meaningless.
ROE and ROCE both above 15%, close to each other, and low debt = genuine quality signal
ROE significantly higher than ROCE = debt is amplifying returns; check debt-to-equity and interest coverage
ROCE higher than ROE = company is equity-heavy, possibly under-leveraged; returns are real, but capital allocation needs improvement
A 20% ROE is exceptional in steel. In FMCG, it suggests underperformance. Always benchmark against the sector average, not a fixed absolute number.
This 3-step check takes under 5 minutes per stock once you have the data in front of you.
Picking out ROE and ROCE data manually by looking into the annual reports of more than 100 stocks can take hours. It’s best to filter them based on both criteria together.
With the Dhanarthii stock screener, you can filter ROE greater than 15%, ROCE greater than 15%, and debt/equity less than 1 all at once to pick out a list of capital-efficient and low-debt Indian stocks within 30 seconds.
Filter out all NSE-listed stocks that have ROE greater than 15% and ROCE greater than 15% all at once using the Dhanarthi stock screener in under 30 seconds.
ROE tells you the efficiency with which an organisation generates profits for the stockholders. ROCE is a measure of capital usage efficiency by the organisation. By itself, neither is adequate for analysing stocks.
For industries such as IT and FMCG, both ratios will have higher numbers by default. For heavy capital-intensive industries such as construction, metals, or public sector undertakings, ROCE would be a better metric. For financial stocks, neither ROE nor ROCE alone can help; use ROA.
An organization which maintains both the metrics in excess of 15% with no or low debt is one of the purest forms of quality screens in fundamental analysis.
Disclaimer: This article is for educational purposes only. It does not constitute investment advice. Please consult a SEBI-registered financial advisor before making investment decisions.
1. What is the difference between ROE and ROCE?
ROE (Return on Equity) measures how much profit a company generates per rupee of shareholders' equity. ROCE (Return on Capital Employed) measures profit generated per rupee of total capital used, including both equity and debt. ROE uses net profit in its formula, while ROCE uses EBIT.
2. Which is more important for stock analysis, ROE or ROCE?
Neither is universally more important. For capital-intensive businesses like infrastructure, metals, or PSUs, ROCE is more reliable because ROE can be distorted by debt levels.
3. What is a good ROE for Indian stocks?
A ROE above 15% sustained consistently over 5 years is a positive indicator for Indian stocks. ROE above 20% signals strong management efficiency.
4. What is a good ROCE for Indian stocks?
ROCE above 15% is generally considered healthy across most Indian sectors. In capital-intensive sectors like infrastructure and power, consistent ROCE above 12% is acceptable given large fixed asset bases.
5. Can a company have high ROE and low ROCE?
Yes, and this is a warning signal. A company can show high ROE when it carries heavy debt. The interest expense reduces taxable income, and the smaller equity base inflates the ROE figure.
6. Can a company have high ROCE and low ROE?
Yes. This typically occurs when a company is under-leveraged or equity-heavy. It has a large equity base that dilutes shareholder-specific returns, keeping ROE low. But because total capital is being used efficiently, ROCE remains high. This is not necessarily a red flag it may indicate a conservatively financed business.
7. Why is ROCE better for capital-intensive companies?
Capital-intensive companies like power plants, steel mills, and telecom operators carry large amounts of debt to fund fixed assets. ROE in these businesses can look misleadingly high or low depending on leverage levels.
8. How do you calculate ROE and ROCE?
ROE = (Net Profit / Shareholders' Equity) x 100. Net profit is taken from the income statement. Shareholders' equity is from the balance sheet. ROCE = (EBIT / Capital Employed) x 100. Capital Employed = Total Assets minus Current Liabilities.
9. Should I use ROE or ROCE for banking and PSU stocks?
For banking stocks, neither ROE nor ROCE alone is sufficient. Banks use debt (deposits) as their core business model, making ROCE less meaningful. Use ROE alongside Return on Assets (ROA) for banks.
10. How do I use ROE and ROCE together for stock picking?
Use this 3-step check: First, confirm ROCE has stayed above 15% consistently over at least 5 years. Second, compare ROE and ROCE if both are high and close to each other with low debt, it signals genuine quality.
Share Market
IPO
Artificial Intelligence
Semi Conductor