
PEG Ratio: Better Than P/E for Growth Stocks?
July 1, 2026

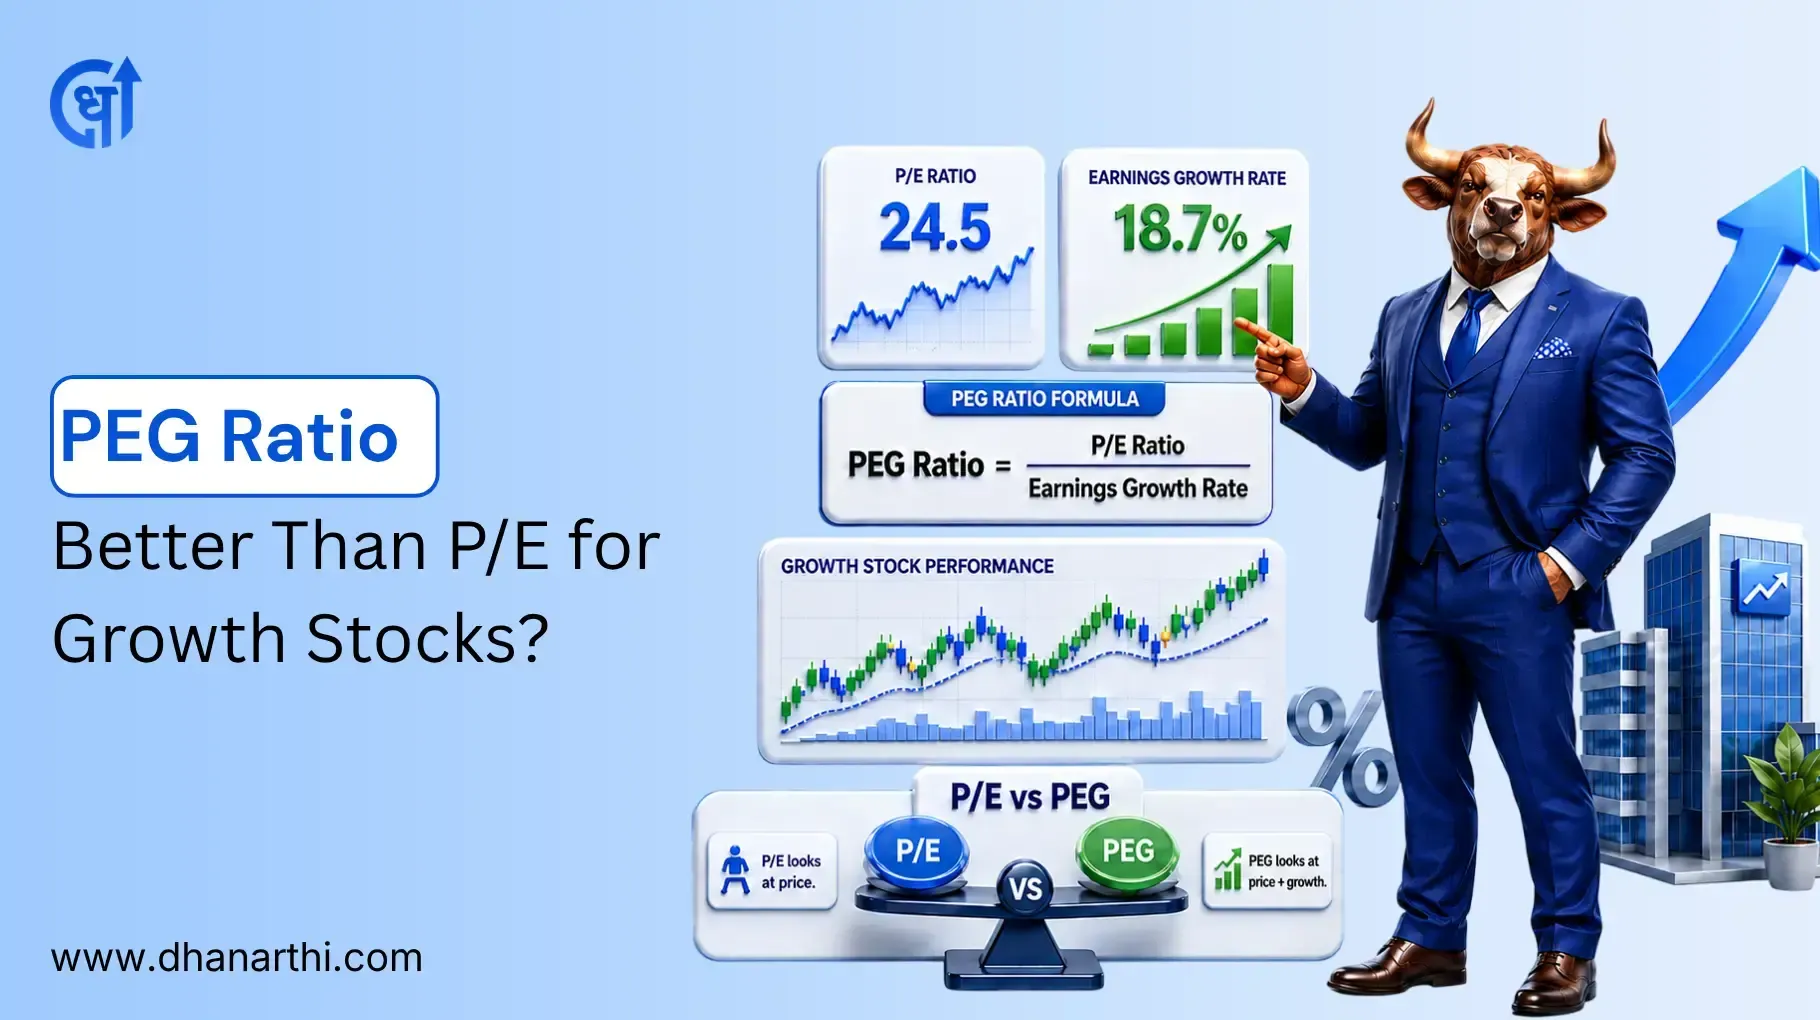
TABLE OF CONTENTS
Get an AI Summary of This Post Using The Tools Below.


PEG Ratio basically takes a stock’s P/E ratio then divides it by the expected EPS growth rate, so you get a kind of valuation metric that kinda accounts for growth, not just earnings. If the PEG is near 1, it can mean the value is pretty fair, while a number under 1 often points to undervaluation, and above 1 tends to hint at overvaluation. The big difference, compared with using only the P/E ratio, is that PEG leans into how quickly the company is growing. So it usually becomes more handy for comparing growth stocks, even when their P/E levels look similar.
PEG Ratio = P/E Ratio ÷ EPS Growth Rate
P/E ratio alone ignores growth, which makes high-growth stocks look artificially expensive
PEG below 1 generally signals undervaluation, above 1 signals overvaluation, around 1 signals fair value
PEG works best within the same sector and breaks down for companies with negative or erratic earnings
For the full mechanics of the P/E ratio before layering in growth, read P/E ratio explained
The P/E ratio shows, kinda, how much investors are paying for each rupee a company earns. Like a stock trading at a P/E of 30 means investors pay Rs 30 for every Rs 1 of annual earnings, sort of.
P/E Ratio = Market Price per Share / Earnings Per Share (EPS)
Now a high P/E might suggest the market expects solid future growth, or it can also mean the share is just overpriced in a straightforward way. A low P/E, on the other hand, might signal a real bargain, though it could also mean the market has already priced in modest prospects.
And P/E by itself cannot really separate “good growth” from “overvaluation”, so right there is the gap PEG steps in and fills, basically.
The P/E ratio formula uses two inputs: current market price and EPS, and it sort of depends on what you mean. In practice, there are two versions that people use a lot, for example trailing P/E vs forward P/E.
Trailing P/E uses EPS from the last 12 months of actual reported earnings.
Forward P/E uses projected EPS for the next 12 months based on analyst estimates.
Trailing P/E is kind of grounded in real filed numbers, while forward P/E sort of reacts quicker to anticipated changes, but it depends on guesses that might be wrong. Most screeners and broker reports show the trailing P/E by default unless they say otherwise, labeled clearly or not; sometimes you just see it… like that.
PEG ratio meaning, in simple terms, is basically the P/E ratio that's tweaked for how quickly a company’s earnings are growing, so it’s not just price being compared to profits. Investor Peter Lynch popularised the idea that a fairly priced company should have a P/E that sort of matches its earnings growth speed, and when you line those up, the PEG comes out around 1.
PEG Ratio = P/E Ratio / EPS Growth Rate (as a whole number, not a decimal percentage)
So, you have this company, with a P/E around 20, and its expected EPS growth rate is also roughly 20%, then the PEG lands at about 1. That basically, um, implies the market has priced the share pretty much in step with its growth.
But if you keep the P/E the same, 20, and you compare it to a slower growth rate of only 10%, then the PEG becomes 2, which kind of means the stock looks pricey relative to how quickly it’s really expanding.
Dixon Technologies showed a market capitalisation of Rs 72,417 crore alongside a trailing 12-month net profit of Rs 1,644 crore, so its trailing P/E seems around 44x (Source: screener.in company data, May 2026).
Using a broker consensus EPS growth estimate of around 25% for the company, the PEG calculation works out as follows:
PEG = 44 / 25 = 1.76
| Step | Figure |
|---|---|
| Trailing P/E | ~44x |
| Estimated EPS Growth Rate | ~25% |
| PEG Ratio | 1.76 |
Data sourced from screener.in company filings data. Last updated: June 2026.
A PEG above 1.5 typically signals the market is pricing in more growth than current estimates support, which is common for high-growth consumer electronics manufacturing stocks where investors pay up for future expansion plans. To screen Indian stocks by P/E, growth, and other ratios together, the stock screener lets you filter on these metrics in one place.
The EPS growth rate is, honestly, the hardest input to pin down, and like where you actually pull it from, changes your PEG result. It can be small stuff, but still it shifts the whole outcome.
Broker consensus estimates: you can find these on platforms such as Moneycontrol, Trendlyne, or even from your broker’s research terminal. Usually they’re analyst projections for the next 1-2 years, and they keep updating fairly often.
Trailing 3-5 year EPS CAGR: this is calculated from older annual reports. It feels more objective because it uses filed numbers, but it also looks backward, and it might not capture whether the business is slowing down or speeding up.
Screener-based growth figures: these tools pull EPS history straight from exchange filings so you get a quick CAGR, but they seldom fine-tune for one-off events like asset sales or tax changes.
For most retail investors, matching a 3-year trailing EPS CAGR with the latest broker estimate tends to produce a more balanced PEG than leaning only on either one, by itself.
| Metric | What It Measures | Best Used For |
|---|---|---|
| P/E Ratio | Price paid per rupee of current earnings | Comparing mature, stable-growth companies |
| PEG Ratio | Price paid per rupee of earnings, adjusted for growth | Comparing companies with different growth rates, especially growth stocks |
For growth stocks, P/E on its own often makes a stock seem more expensive than it really is, because it ignores how quickly earnings are actually expanding. PEG kind of fixes that, by taking the growth rate and dividing it into the picture, so you end up with something more comparable.
That’s why it’s usually viewed as the more useful thing when you are lining up a fast-moving IT or consumer name against a peer that’s growing slower, even inside the same sector.
Equity mutual funds share a portfolio P/E ratio, basically a weighted average of the P/E for all the stocks sitting inside the fund. Fund houses publish this number every month through factsheets (Source: AMFI monthly disclosure norms) or something like that.
If the portfolio P/E is high, then it usually signals the fund is holding well-priced stocks, often leaning more towards growth-oriented themes. If it is low, then the fund is more inclined toward value stocks, trading at cheaper multiples versus their earnings, you know, generally speaking.
Also, this number isn’t the same as one single stock’s PEG ratio. It’s more like a blended snapshot across the entire portfolio, and it doesn’t treat growth the same way PEG does.
A common investor mistake is to just trust the PEG that’s calculated from one single year of EPS growth, especially when you are looking at cyclical sectors. In PSU banks, metals, and infrastructure companies, you often get one shining year after a downturn, and that can make EPS growth look wildly high, so the PEG appears artificially cheap or low.
Like, a metals company that bounces back after a loss-making year may show EPS growth above 100%, not because the business is structurally stronger, but because the prior-year starting point was kind of crushed.
Like, a metals company that bounces back after a loss-making year may show EPS growth above 100%, not because the business is structurally stronger, but because the prior-year starting point was kind of crushed.
PEG should not be used in every situation. It breaks down or becomes meaningless in several common cases.
Negative earnings: Companies with negative EPS produce a negative or undefined PEG that carries no useful meaning
Newly listed or pre-profit companies: No earnings history means no reliable growth rate to use
Highly cyclical sectors: Aviation, shipping, and commodity stocks see EPS swing wildly year to year, distorting PEG
No adjustment for return on equity or debt: Two companies with identical PEG can have very different capital efficiency and risk
PEG works best as one input alongside other ratios, not as a standalone buy or sell signal. For a deeper, data-backed read on a company's growth and valuation together, the AI Financial Research Assistant pulls these figures directly from filings.
PEG ratio is kind of like it improves on P/E by folding in growth metrics, so it becomes more useful when you compare firms that are not moving together at the same pace. It is not really a replacement for P/E, more like a refinement, and honestly it tends to work best when the growth rate that feeds it is verified for sustainability, rather than simply accepted at face value.
Disclaimer: This article is for educational purposes only. It does not constitute investment advice. Please consult a SEBI-registered financial advisor before making investment decisions.
1. What is PEG ratio?
PEG ratio divides a stock's P/E ratio by its expected EPS growth rate. It adjusts the standard P/E for how fast a company is growing, making it easier to compare stocks with different growth profiles.
2. What is a good PEG ratio?
A PEG ratio around 1 generally suggests fair value. Below 1 suggests the stock may be undervalued relative to its growth, while above 1 suggests it may be overvalued.
3. How to calculate PEG ratio?
Divide the P/E ratio by the EPS growth rate, expressed as a whole number. For example, a P/E of 20 with a growth rate of 20% gives a PEG of 1.
4. Is PEG ratio better than PE ratio?
For growth stocks, yes. PEG accounts for the pace of earnings growth, which P/E ignores. For stable, low-growth companies, plain P/E often works just as well.
5. What is the price earnings ratio formula?
P/E Ratio = Market Price per Share divided by Earnings Per Share. It shows how much investors pay for every rupee of a company's earnings.
6. What does PE ratio mean in mutual funds?
It refers to the weighted average P/E of all stocks in a mutual fund's portfolio, disclosed monthly in fund factsheets. It shows whether the fund leans toward expensive or cheaply valued stocks.
7. Can PEG ratio be negative?
Yes, when a company has negative earnings or a declining growth rate. A negative PEG is generally treated as meaningless rather than a buy signal.
8. Why is PEG ratio unreliable for cyclical stocks?
Cyclical companies in sectors like metals or aviation can show a huge EPS jump after a weak year, which inflates the growth rate and makes PEG look artificially low.
9. Should I use trailing or forward PE for PEG calculation?
Both are used in practice. Trailing PEG relies on actual reported earnings, while forward PEG uses projected earnings and reacts faster but depends on the accuracy of analyst estimates.
10. Is a low PEG ratio always a buying opportunity?
Not always. A low PEG can result from an unsustainable growth spike rather than genuine undervaluation, so the underlying growth rate should always be checked before acting on it.
Share Market
IPO
Artificial Intelligence
Semi Conductor