




Silver Price Today: History in India (1983-2026)
August 4, 2026



TABLE OF CONTENTS
Get AI Summary





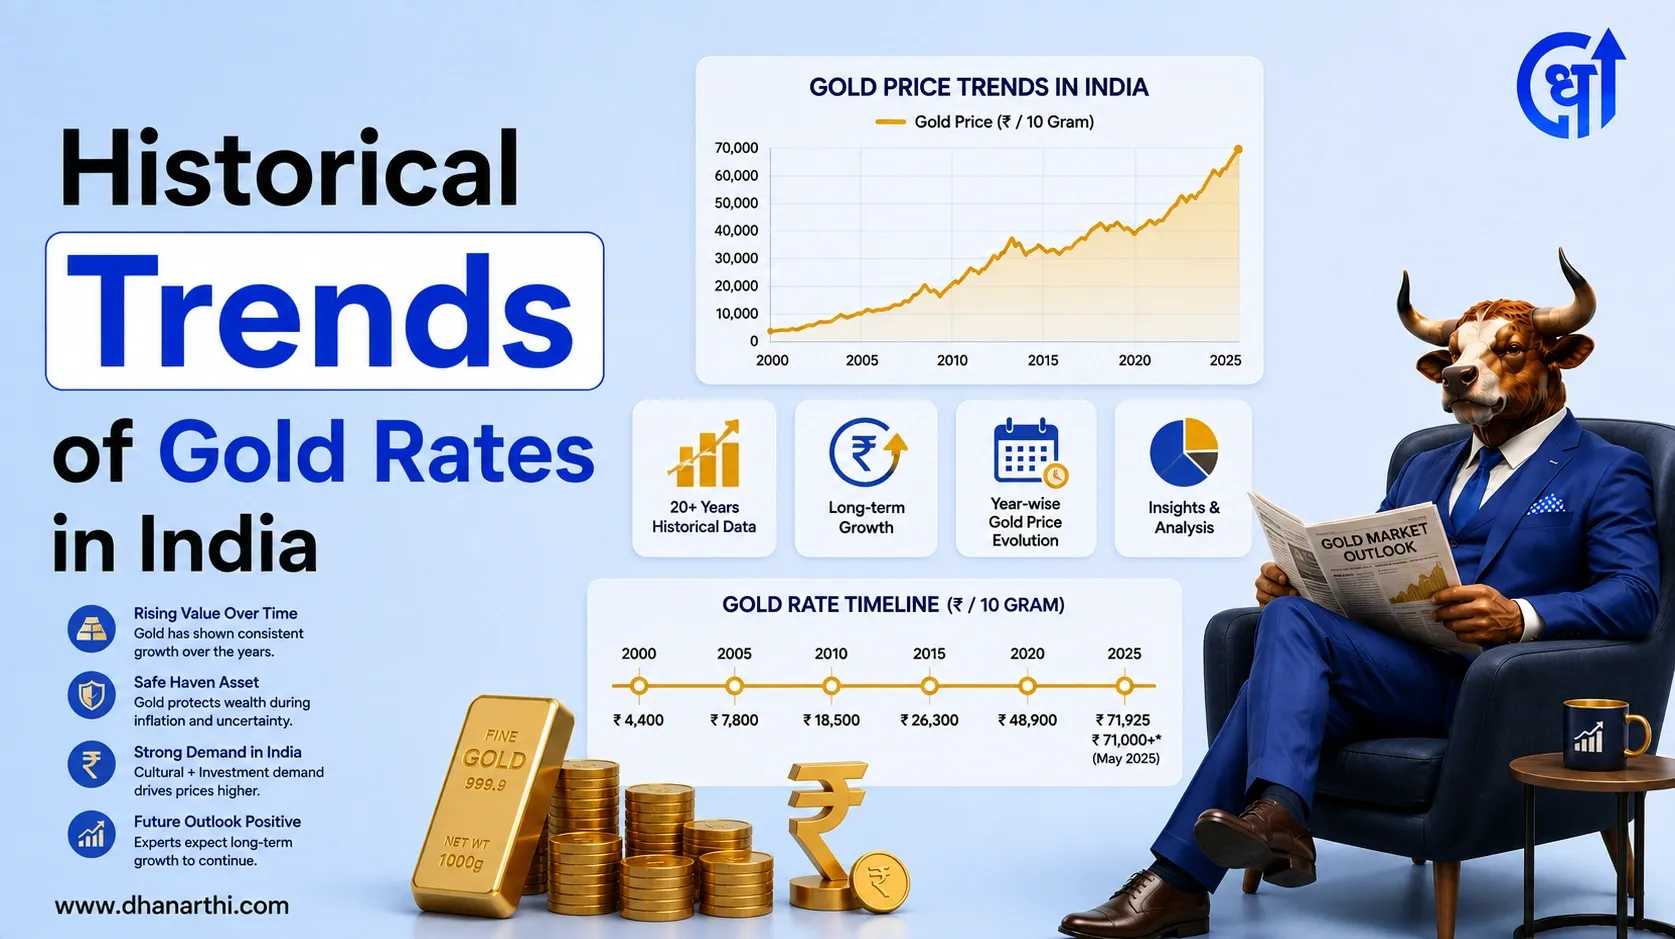
Gold price today stands at Rs 14,421 per gram (Rs 1,44,210 per 10 grams) for 24 karat gold and Rs 13,219 per gram (Rs 1,32,190 per 10 grams) for 22 karat gold in India (Source: Goodreturns, August 4, 2026). Since 1964-65, when 24K gold averaged Rs 63 per 10 grams, prices have grown steadily, with the sharpest gains coming after 2008.
24K gold trades at Rs 1,44,210 per 10 grams today, up from Rs 63.25 per 10 grams in 1964-65 and roughly Rs 29,190 per 10 grams in FY2013-14 (Source: RBI; Goodreturns).
Gold crossed Rs 50,000 per 10 grams in 2020, Rs 1,00,000 in 2025, and touched an all-time high near Rs 1,69,349 in March 2026 (Source: CreditMantri).
A Rs 1,00,000 investment in 24K gold in 2014 would be worth roughly Rs 5,15,000 today, a compounded annual return near 14-15%.
Gold has outperformed the Nifty 50, fixed deposits, and real estate over the last decade on a compounded basis (Source: GoldAndIPO historical data).
Analysts project gold could trade between Rs 1.2 lakh and Rs 2 lakh per 10 grams by 2030, depending on US Federal Reserve policy and global demand.
Gold rates change daily based on international spot prices, the rupee-dollar exchange rate, and import duty. As of today, prices stand as follows.
| Purity | Price per gram | Price per 10 grams |
|---|---|---|
| 24 Karat (99.9%) | Rs 14,421 | Rs 1,44,210 |
| 22 Karat (91.6%) | Rs 13,219 | Rs 1,32,190 |
| 18 Karat (75%) | Rs 10,815 | Rs 1,08,150 |
Data sourced from Goodreturns. Last updated: August 2026.
Retail jewellery is usually sold in 22K gold since pure 24K gold is too soft for daily-wear ornaments. City-wise rates can vary slightly due to local taxes and making charges, but the base rate stays consistent nationwide since it tracks the same international benchmark.
Gold rate history in India goes back over six decades. The table below shows the gold price chart India 10 year and beyond, using financial-year average prices for 24K gold per 10 grams.
| Financial Year | 24K Gold Rate (Rs per 10g) | YoY Change |
|---|---|---|
| 1964-65 | 63.25 | - |
| 1965-66 | 71.75 | 13.4% |
| 1966-67 | 83.75 | 16.7% |
| 1967-68 | 102.50 | 22.4% |
| 1968-69 | 162.00 | 58.0% |
| 1969-70 | 176.00 | 8.6% |
| 1970-71 | 184.00 | 4.5% |
| 1971-72 | 193.00 | 4.9% |
| 1972-73 | 242.57 | 25.7% |
| 1973-74 | 369.33 | 52.3% |
| 1974-75 | 519.19 | 40.6% |
| 1975-76 | 545.21 | 5.0% |
| 1976-77 | 549.82 | 0.8% |
| 1977-78 | 637.93 | 16.0% |
| 1978-79 | 791.22 | 24.0% |
| 1979-80 | 1,158.75 | 46.5% |
| 1980-81 | 1,522.44 | 31.4% |
| 1981-82 | 1,719.17 | 12.9% |
| 1982-83 | 1,722.54 | 0.2% |
| 1983-84 | 1,858.47 | 7.9% |
| 1984-85 | 1,983.92 | 6.8% |
| 1985-86 | 2,125.47 | 7.1% |
| 1986-87 | 2,323.49 | 9.3% |
| 1987-88 | 3,082.43 | 32.7% |
| 1988-89 | 3,175.22 | 3.0% |
| 1989-90 | 3,229.33 | 1.7% |
| 1990-91 | 3,451.52 | 6.9% |
| 1991-92 | 4,297.63 | 24.5% |
| 1992-93 | 4,103.66 | -4.5% |
| 1993-94 | 4,531.87 | 10.4% |
| 1994-95 | 4,667.24 | 3.0% |
| 1995-96 | 4,957.60 | 6.2% |
| 1996-97 | 5,070.71 | 2.3% |
| 1997-98 | 4,347.07 | -14.3% |
| 1998-99 | 4,268.17 | -1.8% |
| 1999-00 | 4,393.56 | 2.9% |
| 2000-01 | 4,473.60 | 1.8% |
| 2001-02 | 4,579.12 | 2.4% |
| 2002-03 | 5,332.36 | 16.4% |
| 2003-04 | 5,718.95 | 7.2% |
| 2004-05 | 6,145.38 | 7.5% |
| 2005-06 | 6,900.56 | 12.3% |
| 2006-07 | 9,240.32 | 33.9% |
| 2007-08 | 9,995.62 | 8.2% |
| 2008-09 | 12,889.74 | 29.0% |
| 2009-10 | 15,756.09 | 22.2% |
| 2010-11 | 19,227.08 | 22.0% |
| 2011-12 | 25,722.42 | 33.8% |
| 2012-13 | 30,163.93 | 17.3% |
| 2013-14 | 29,190.39 | -3.2% |
| 2014-15 | 27,414.55 | -6.1% |
| 2015-16 | 26,534.26 | -3.2% |
| 2016-17 | 29,665.28 | 11.8% |
| 2017-18 | 29,300.08 | -1.2% |
| 2018-19 | 31,193.41 | 6.5% |
| 2019-20 | 37,017.91 | 18.7% |
| 2020-21 | 48,723.22 | 31.6% |
| 2021-22 | 47,999.25 | -1.5% |
| 2022-23 | 52,730.77 | 9.9% |
| 2023-24 | 60,623.95 | 15.0% |
| 2024-25 | 75,841.87 | 25.1% |
| 2025-26 | 1,46,160.00 | 92.7% |
| 2026-27* (as of Aug 2026) | 1,44,210.00 | -1.3% |
FY 2026-27 is a partial-year figure and not directly comparable with full financial-year averages. Data sourced from Reserve Bank of India (RBI) publications and Goodreturns. Last updated: August 2026.
Reading this gold rate history in India, three phases stand out. Prices stayed under Rs 200 per 10 grams through the 1960s under a controlled gold standard. Liberalisation from 1991 opened imports and pushed prices past Rs 4,000 by the mid-1990s. The steepest climb came after 2008, when the global financial crisis, the pandemic, and 2025-26 central bank buying pushed gold from under Rs 13,000 to over Rs 1,44,000 in under two decades.
You are looking at gold as part of the commodity asset class, distinct from equities, and its price behaviour reflects that. Gold tends to rise when confidence in currencies or bond markets falls, which explains the sharp jumps in FY2008-09, FY2020-21, and FY2025-26.
Two years investors ask about most are 2014 and 2016, since they mark the start of the current decade-long rally.
The gold price in 2014 (FY2013-14) averaged Rs 29,190 per 10 grams, a level that looks small compared to today, but it still outpaced bank fixed deposit rates in the years that followed. The gold rate in 2016 (FY2016-17) climbed to about Rs 29,665, recovering from a dip the year before, largely on steady festive and wedding-season demand and a weaker rupee.
2020: The Covid-19 pandemic triggered a global flight to safety, pushing gold past Rs 50,000 per 10 grams for the first time (Source: BankBazaar).
2025: Gold crossed Rs 1,00,000 per 10 grams for the first time in history, driven by aggressive central bank buying, Fed rate-cut expectations, and BRICS nations reducing dollar dependence (Source: GoldAndIPO).
2026: Prices touched an all-time high of Rs 1,69,349 per 10 grams in March 2026 amid the US-Iran conflict and Strait of Hormuz disruptions (Source: CreditMantri).
A concrete example makes the trend easier to grasp than percentages alone.
In 2014, at Rs 29,190 per 10 grams (FY2013-14 average), Rs 1,00,000 bought about 34.3 grams of 24K gold. At today's rate of Rs 14,421 per gram, that same 34.3 grams is worth close to Rs 4,94,700. That works out to a compounded annual growth rate near 13-14% over 12 years, ahead of average fixed deposit returns and broadly in line with long-term Nifty 50 returns, without the day-to-day volatility of equities.
This kind of math is a common mistake area for new investors: many track only the headline price jump and skip the actual compounding, which understates how strong gold's decade has been.
Four forces explain almost all of the movement in Indian gold rates.
International spot price: Indian gold prices are derived from the global USD/oz rate set on the London Bullion Market, so any move there flows through directly.
Rupee-dollar exchange rate: A weaker rupee raises the landed cost of imported gold even when the dollar price stays flat.
Import duty and taxes: India applies customs duty plus GST on gold, which adds a fixed premium over the raw international rate.
Domestic demand cycles: Wedding season, Akshaya Tritiya, and Diwali create predictable seasonal demand spikes that nudge local premiums higher.
Investors who want direct exposure to this price movement without holding physical gold often look at the best Gold ETFs in India, which track the metal's price closely while avoiding storage and purity concerns.
Each route to gold exposure comes with a different cost and liquidity profile.
| Investment Route | Making/Storage Cost | Liquidity | Returns Beyond Price |
|---|---|---|---|
| Physical Gold (jewellery/coins) | High (making charges 8-25%) | Moderate, needs a buyer | None |
| Gold ETF | Low (expense ratio ~0.5-1%) | High, trades like a stock | None |
| Sovereign Gold Bond (SGB) | None | Low, 8-year lock-in (tradeable on exchange) | 2.5% annual interest |
| Digital Gold | Low, but GST applies | High | None |
Data sourced from AMFI, NSE. Last updated: August 2026.
Before picking a route, it helps to understand the mechanics of each option in detail. A side-by-side look at a Gold ETF versus a Gold Mutual Fund is a useful next step, since the two look similar but differ in how units are bought and priced.
Analyst forecasts vary widely and should be treated as scenarios, not guarantees. Based on projections from EBC Financial Group and TradersUnion, a base-case path puts gold between Rs 1.2 lakh and Rs 1.37 lakh per 10 grams by 2030, with a bullish scenario reaching Rs 1.5-2 lakh if central bank buying and geopolitical risk stay elevated. A weaker case, if the dollar strengthens and risk appetite returns to equities, could see prices settle in the low Rs 1 lakh range.
The main variables to watch are US Federal Reserve rate decisions, the pace of central bank gold purchases globally, and the rupee-dollar exchange rate. None of these forecasts should be the sole basis for an investment decision.
New investors often buy heavily during a price spike out of fear of missing out, then hold through a correction with no plan. A steadier approach, similar to SIP investing in mutual funds, spreads gold purchases across several months or years rather than betting on a single entry point. This reduces the risk of buying at a local peak, a mistake seen repeatedly during the 2020 and 2025 rallies.
Gold price today in India reflects more than a decade of consistent appreciation, from about Rs 28,000 per 10 grams in 2014 to over Rs 1,44,000 now. The year-wise data shows gold rarely falls for long, and when it does, it tends to recover within a year or two. For most retail investors, the practical question is not whether to hold gold, but how much of a portfolio it should occupy and through which instrument.
1. What is the gold price in India today?
Gold price today is Rs 14,421 per gram (Rs 1,44,210 per 10 grams) for 24K gold, and Rs 13,219 per gram for 22K gold. Rates change daily based on international spot prices and the rupee-dollar rate.
2. What was the gold rate in 2014?
The gold rate in 2014 (FY2013-14) averaged Rs 29,190 per 10 grams for 24K gold, based on RBI data. It was a relatively stable year compared to the sharp rallies seen from 2019 onward.
3. What was the gold rate in 2016?
Gold rate in 2016 (FY2016-17) stood at Rs 29,665 per 10 grams, recovering from a dip the year before. Steady festive and wedding-season demand and a weaker rupee supported the price through the year.
4. How much was gold in 2020?
Gold crossed Rs 50,000 per 10 grams for the first time in 2020, with the average annual price around Rs 48,651. The Covid-19 pandemic drove strong safe-haven demand that year.
5. What is the gold rate prediction for 2030?
Analyst estimates place gold between Rs 1.2 lakh and Rs 1.37 lakh per 10 grams by 2030 in a base case, with a bullish scenario reaching Rs 1.5-2 lakh depending on central bank buying and Fed policy.
6. Is gold a good investment in 2026?
Gold has delivered close to 14-15% CAGR over the past decade, outperforming fixed deposits and matching long-term equity returns with lower volatility. It works best as one part of a diversified portfolio rather than a standalone bet.
7. Why does gold price change every day?
Gold price changes daily because it tracks the international spot price set on the London Bullion Market, which moves with the US dollar, interest rates, and global demand, then gets converted to rupees.
8. What is the difference between 22K and 24K gold price?
24K gold is 99.9% pure and trades higher, while 22K gold is 91.6% pure and priced lower per gram. Jewellery is typically made from 22K gold since pure 24K is too soft for daily wear.
9. How is gold price calculated in India?
Indian gold price starts with the international USD per ounce rate, gets converted to rupees using the current exchange rate, then has import duty, GST, and local premiums added on top.
10. Is digital gold safe as an investment?
Digital gold is backed by physical gold held by the seller and offers high liquidity with low storage cost, but it is not regulated by SEBI the way Gold ETFs and Sovereign Gold Bonds are, so it carries counterparty risk.
Share Market
IPO
Artificial Intelligence
Semi Conductor