

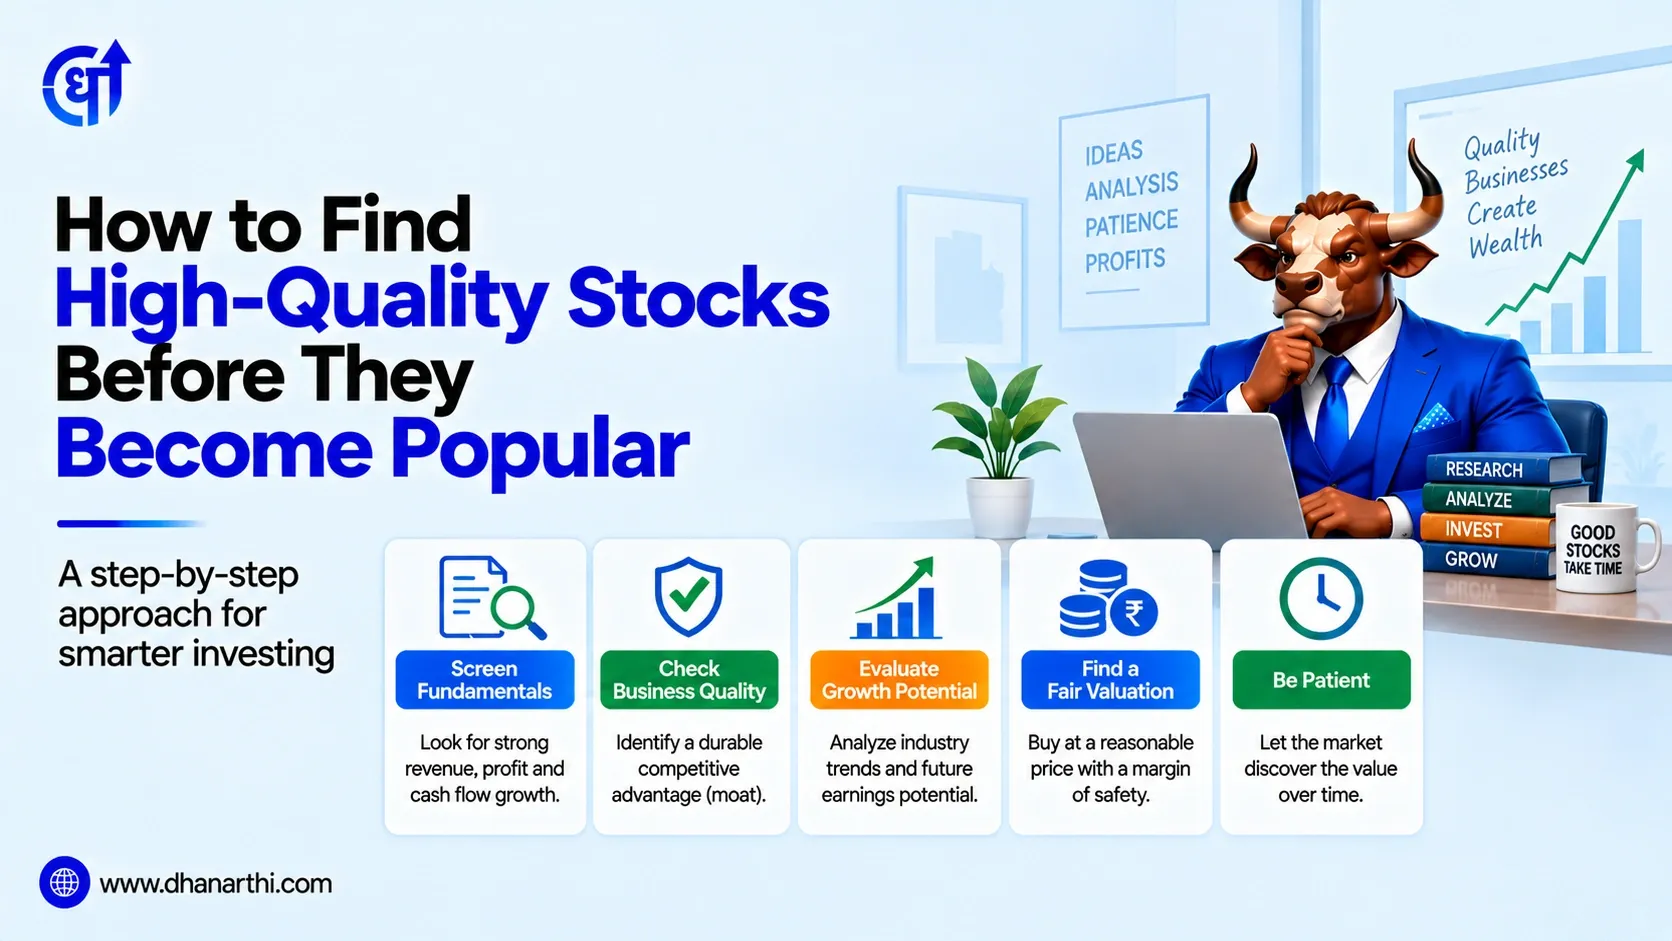
How to Find High-Quality Stocks Before They Get Popular
September 22, 2026



TABLE OF CONTENTS
Get AI Summary





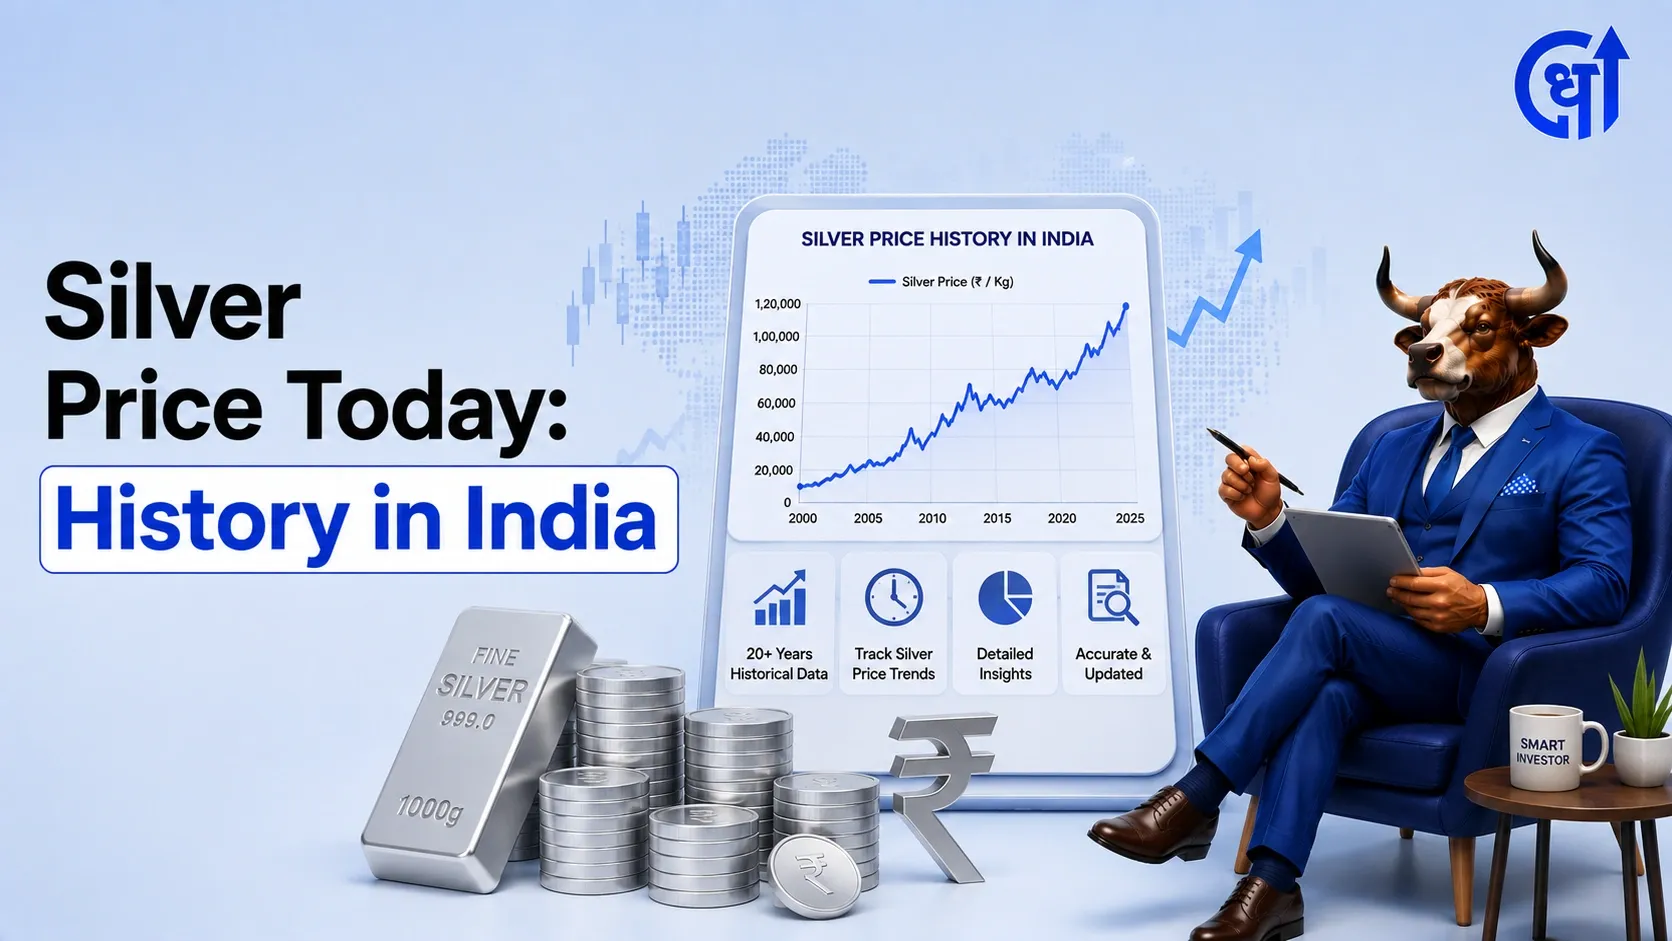
Silver price today stands at Rs 235 per gram (Rs 2,35,000 per kilogram) in India. Silver has climbed from around Rs 3,506 per kg in 1983-84 to current levels, a journey marked by long quiet stretches followed by sharp, fast-moving rallies, most recently in January 2026.
Silver rates move daily with international spot prices, the rupee-dollar rate, and domestic demand. As of today, rates stand as follows.
| Unit | Price |
|---|---|
| Per gram | Rs 235 |
| Per 10 grams | Rs 2,350 |
| Per kilogram | Rs 2,35,000 |
Data sourced from Goodreturns. Last updated: August 2026.
Unlike gold, silver has no separate purity grades in everyday retail pricing since investment-grade silver is typically 99.9% pure. City-wise premiums exist due to local taxes and making charges on jewellery and articles, but the base bullion rate tracks the same national benchmark.
Silver price history in India goes back over four decades of RBI records. The table below shows the silver price chart 30 years in India and beyond, using financial-year average prices per kilogram.
| Financial Year | Silver Rate (Rs/kg) | YoY Change |
|---|---|---|
| 1983-84 | 3,506 | - |
| 1984-85 | 3,594 | +2.5% |
| 1985-86 | 3,918 | +9.0% |
| 1986-87 | 4,247 | +8.4% |
| 1987-88 | 5,539 | +30.4% |
| 1988-89 | 6,367 | +14.9% |
| 1989-90 | 6,842 | +7.5% |
| 1990-91 | 6,761 | -1.2% |
| 1991-92 | 7,332 | +8.4% |
| 1992-93 | 7,078 | -3.5% |
| 1993-94 | 6,348 | -10.3% |
| 1994-95 | 6,692 | +5.4% |
| 1995-96 | 7,221 | +7.9% |
| 1996-97 | 7,165 | -0.8% |
| 1997-98 | 7,352 | +2.6% |
| 1998-99 | 7,855 | +6.8% |
| 1999-00 | 8,067 | +2.7% |
| 2000-01 | 7,868 | -2.5% |
| 2001-02 | 7,447 | -5.4% |
| 2002-03 | 7,991 | +7.3% |
| 2003-04 | 8,722 | +9.1% |
| 2004-05 | 10,681 | +22.5% |
| 2005-06 | 11,829 | +10.8% |
| 2006-07 | 19,057 | +61.1% |
| 2007-08 | 19,427 | +1.9% |
| 2008-09 | 21,248 | +9.4% |
| 2009-10 | 25,321 | +19.2% |
| 2010-11 | 37,290 | +47.3% |
| 2011-12 | 57,316 | +53.7% |
| 2012-13 | 57,602 | +0.5% |
| 2013-14 | 46,637 | -19.0% |
| 2014-15 | 40,558 | -13.0% |
| 2015-16 | 36,318 | -10.5% |
| 2016-17 | 42,748 | +17.7% |
| 2017-18 | 39,072 | -8.6% |
| 2018-19 | 38,404 | -1.7% |
| 2019-20 | 42,514 | +10.7% |
| 2020-21 | 59,283 | +39.5% |
| 2021-22 | 65,426 | +10.4% |
| 2022-23 | 61,991 | -5.2% |
| 2023-24 | 72,243 | +16.5% |
| 2024-25 | 89,131 | +23.4% |
| 2025-26* (as of Aug 2026) | 2,35,000 | +163.7% |
FY 2025-26 is a partial-year MCX spot figure, not a full financial-year RBI average, and includes the sharp January 2026 spike and subsequent correction, so it is not directly comparable to earlier rows. Data sourced from RBI Handbook of Statistics and MCX India. Last updated: August 2026.
For comparison, gold's price history over the same decades shows a steadier, less volatile climb, since gold is driven mainly by investment demand while silver carries an added industrial layer.
The silver rate trend breaks into five distinct phases, each shaped by a different set of forces.
Looking at silver price last 10 years in India alongside longer time frames shows how much the growth rate has accelerated recently.
| Period | Starting Price (Rs/kg) | CAGR |
|---|---|---|
| Last 5 years | 42,514 | ~42.5% |
| Last 10 years | 40,558 | ~19.9% |
| Last 20 years | 11,829 | ~16.4% |
| Since 1983 (42 years) | 3,506 | ~10.6% |
Data sourced from RBI Handbook of Statistics and MCX India, via IndiaGraphs research. Last updated: April 2026.
To put this in concrete terms, Rs 1,00,000 invested in silver in 1983 would be worth close to Rs 67 lakh today, based purely on price appreciation and before accounting for storage, taxes, or the form in which silver was held. This kind of long-horizon compounding is easy to miss when looking only at year-to-year percentage swings, especially given how sharply silver corrected after its January 2026 peak.
Five forces explain most of the movement in Indian silver rates.
This mix of industrial and investment demand is part of why commodities behave differently from equities as an asset class, reacting to both factory orders and investor sentiment at the same time.
Silver and gold often move in the same direction, but their behaviour differs in important ways.
| Factor | Gold | Silver |
|---|---|---|
| Primary demand driver | Investment, central bank buying | Industrial use plus investment |
| Long-term volatility | Lower, steadier climb | Higher, sharper cycles |
| 10-year approx. CAGR | ~14-15% | ~19-20% |
| Market size | Larger, more liquid | Smaller, more reactive to buying spikes |
| Typical role in a portfolio | Stability, inflation hedge | Growth potential, higher risk |
Investors sometimes track the gold-silver ratio, which shows how many ounces of silver it takes to buy one ounce of gold, as a rough gauge of relative value between the two metals.
Silver's demand base has shifted well beyond ornaments and cutlery over the past two decades.
| Usage | Approx. Share of Global Demand |
|---|---|
| Electronics and EVs | 25-30% |
| Jewellery and silverware | 25-30% |
| Investment (coins, bars, ETFs) | 10-20% |
| Solar energy (photovoltaic cells) | 18-20% |
| Medical and hygiene applications | 5-10% |
Shares are indicative global estimates and vary year to year with industrial cycles. Data sourced from IndiaGraphs research.
This industrial layer is the main reason silver prices can move faster and further than gold in short windows, since factory-level buying adds to investor demand rather than replacing it.
Each route into silver carries a different cost and liquidity profile.
| Investment Route | Making/Storage Cost | Liquidity | Purity Assurance |
|---|---|---|---|
| Physical silver (coins/bars/articles) | High (making charges, storage risk) | Moderate, needs a buyer | Depends on hallmarking |
| Silver ETF | Low (expense ratio ~0.5-1%) | High, trades like a stock | Backed by physical silver, SEBI regulated |
| Digital silver | Low, but GST applies | High | Backed by seller's physical stock |
Data sourced from AMFI, NSE. Last updated: August 2026.
For investors who want direct price exposure without storage concerns, a look at the best Silver ETFs in India is a practical next step, since these funds track the metal's price while staying within SEBI's regulatory framework.
Silver's long-term numbers look strong, with a 10-year CAGR near 19-20%, but the path there has been anything but smooth. The metal fell more than 30% from its January 2026 peak within weeks, a reminder that silver's smaller market size makes it far more reactive than gold to sudden shifts in buying or selling. For investors who can tolerate sharp swings and are building a position gradually rather than timing a single entry, silver's growing industrial role in solar, EVs, and electronics gives it a demand base that gold does not share. It works best as a smaller, higher-risk allocation alongside gold rather than a primary holding.
Silver price today in India reflects a 42-year journey from Rs 3,506 per kg to over Rs 2,35,000 per kg, but that number alone hides just how uneven the path has been. Long flat stretches through the 1990s gave way to sharp, industry-driven rallies from the 2000s onward, including the extreme spike and correction seen in early 2026. For most retail investors, the practical takeaway is that silver rewards patience and a plan for volatility far more than it rewards trying to catch the next spike.
Disclaimer: This article is for educational purposes only. It does not constitute investment advice. Please consult a SEBI-registered financial advisor before making investment decisions.
1. What is the silver price today in India?
Silver price today is Rs 235 per gram and Rs 2,35,000 per kilogram, based on international spot prices and the rupee-dollar exchange rate.
2. What was the silver price in 1983?
Silver price in 1983-84 averaged Rs 3,506 per kilogram, based on RBI Handbook of Statistics data. It marked the starting point of over four decades of long-term price growth.
3. What is the silver rate trend in India?
The silver rate trend shows long flat periods, such as the 1990s, followed by sharp multi-year rallies, such as 2006-2011 and 2020-2026, driven by industrial demand and safe-haven investment flows.
4. Why is silver more volatile than gold?
Silver is more volatile than gold because its market is smaller and it carries added industrial demand from solar panels, electronics, and EVs, which makes prices react faster to sudden shifts in buying or selling.
5. What is the silver price last 10 years in India?
Silver has compounded at roughly 19-20% annually over the last 10 years, rising from around Rs 40,558 per kg in 2014-15 to current levels above Rs 2,35,000 per kg.
6. Is silver a good investment in 2026?
Silver can work as a smaller, higher-risk allocation alongside gold, given its strong long-term CAGR, but its sharp swings, including a correction of over 30% from its January 2026 peak, mean it suits investors who can tolerate volatility.
7. What is the gold-silver ratio?
The gold-silver ratio shows how many ounces of silver it takes to buy one ounce of gold, and investors use it as a rough gauge of whether silver is cheap or expensive relative to gold at a given time.
8. How is silver price calculated in India?
Indian silver price starts with the international spot rate, gets converted to rupees using the current exchange rate, then reflects local demand, import costs, and any applicable taxes.
9. What caused the silver price spike in January 2026?
Silver spiked in January 2026 due to tight global supply, strong industrial demand from solar and electronics manufacturing, and rising investor demand for safe-haven assets, all converging at the same time.
10. Is digital silver safe as an investment?
Digital silver is backed by physical silver held by the seller and offers high liquidity with low storage cost, but unlike Silver ETFs, it is not regulated by SEBI, so it carries counterparty risk.
Share Market
IPO
Artificial Intelligence
Semi Conductor