

How to Check if a Stock Is Overvalued or Undervalued
September 23, 2026



TABLE OF CONTENTS
Get AI Summary





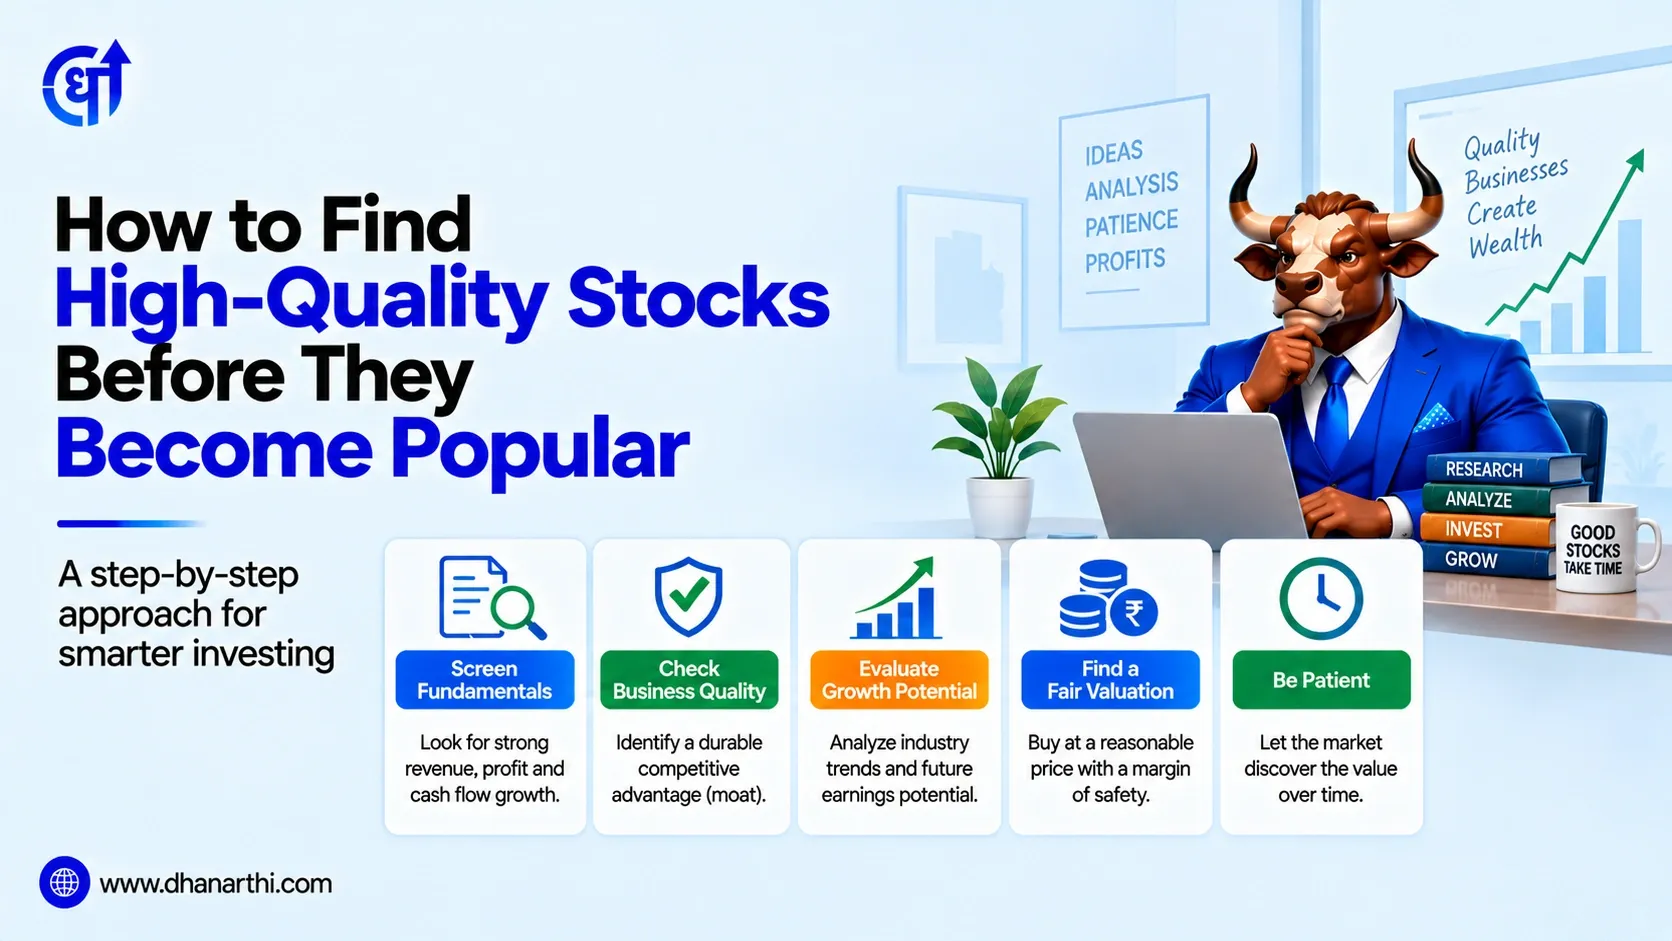
Fundamental stock screening for high-quality companies before they attract widespread attention comes down to four checks: strong and improving business fundamentals, earnings quality backed by real cash flow, a durable competitive advantage, and a purchase price that leaves a margin of safety below the stock's estimated intrinsic value. Stocks meeting all four often stay under-the-radar simply because fewer analysts are watching them closely enough to notice.
Before looking at how to identify quality stocks early, it helps to understand why some genuinely strong companies remain unnoticed for longer than their fundamentals would suggest. The answer largely comes down to analyst coverage. Data compiled from Bank of America and FactSet shows small-cap stocks average around 6 analysts covering them, compared to 17 for mid-cap stocks and 30 for large-cap stocks.
This coverage gap matters because when fewer analysts study a company, less information about its growth potential and risks reaches the broader market through research reports and price targets. This isn't a flaw in the company, it's simply a function of institutional attention following size and liquidity. For an individual investor willing to do independent research, this gap is precisely where an edge can exist, quality businesses hiding in plain sight simply because Wall Street-style coverage hasn't caught up to them yet.
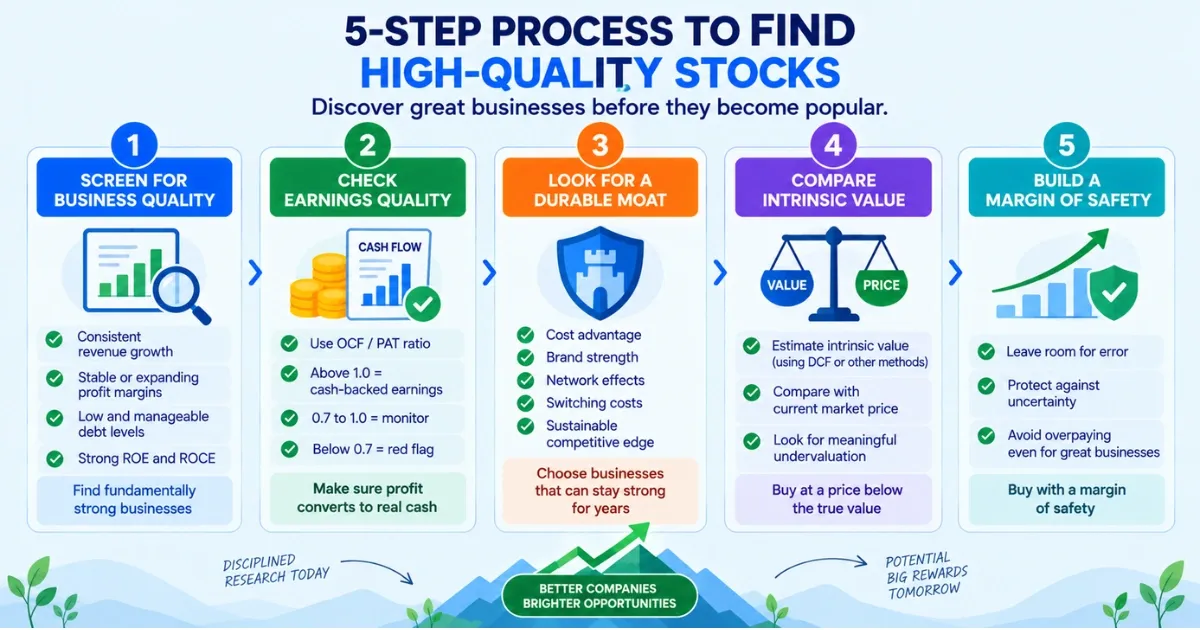
Before diving into valuation or price charts, the first filter should be business quality itself, is this a company with a genuinely strong, improving operating foundation? Key markers include consistent revenue growth over multiple years rather than a single strong quarter, stable or expanding profit margins, low and manageable debt levels, and efficient use of capital reflected in metrics like Return on Equity (ROE) and Return on Capital Employed (ROCE).
Running this kind of multi-factor screen manually across hundreds of listed companies is impractical for most individual investors. The Dhanarthi Stock Screener lets you filter stocks by these exact fundamental parameters together, revenue growth, margin trends, debt ratios, and capital efficiency, narrowing thousands of listed companies down to a manageable shortlist worth deeper research.
This is where many investors stop too early, seeing rising profit and assuming the company is doing well, without checking whether that profit is actually backed by cash. Earnings quality analysis asks a more specific question: is reported profit translating into real, collectible cash, or is it sitting in unpaid receivables and unsold inventory?
A practical way to check this is the Operating Cash Flow to Profit After Tax ratio, calculated as OCF divided by PAT for a given period. A ratio consistently above 1.0 suggests high-quality, cash-backed earnings, the kind seen historically in strong compounding businesses. A ratio below 0.7 is a genuine warning sign, suggesting reported profit may be locked up in receivables, inventory, or aggressive accounting choices rather than showing up as real cash in the business.
| OCF/PAT Ratio | What It Suggests |
|---|---|
| Above 1.0 | High-quality, cash-backed earnings |
| 0.7 to 1.0 | Reasonable, worth monitoring over multiple years |
| Below 0.7 | Possible red flag, profit not converting to cash |
Working through a company's cash flow statement alongside its income statement takes time to do properly across several years of filings. The Dhanarthi Financial Analysis tool pulls these figures directly from company filings, making it considerably faster to check whether a stock's earnings quality actually holds up before going further.
Economic moat analysis asks whether a company has a durable competitive advantage protecting its profitability from competitors over the long run, rather than just a temporarily strong quarter or a cyclical tailwind. Common moat sources include a genuine cost advantage that competitors can't easily replicate, strong brand loyalty that lets a company charge a premium, network effects that make a product more valuable as more people use it, and high switching costs that make customers reluctant to leave once onboarded.
A company without any of these advantages can still grow for a while, but its profitability is more vulnerable to competition eroding margins over time. Business quality analysis that stops at financial ratios alone, without asking why a company can sustain those numbers, misses this deeper, more durable layer of quality.
Research Stocks Smarter with Dhanarthi AI Screener
Analyze 5,000+ NSE & BSE stocks with 150+ custom filters, real-time volume breakout scans, and transparent fundamental data.
Use Dhanarthi Screener
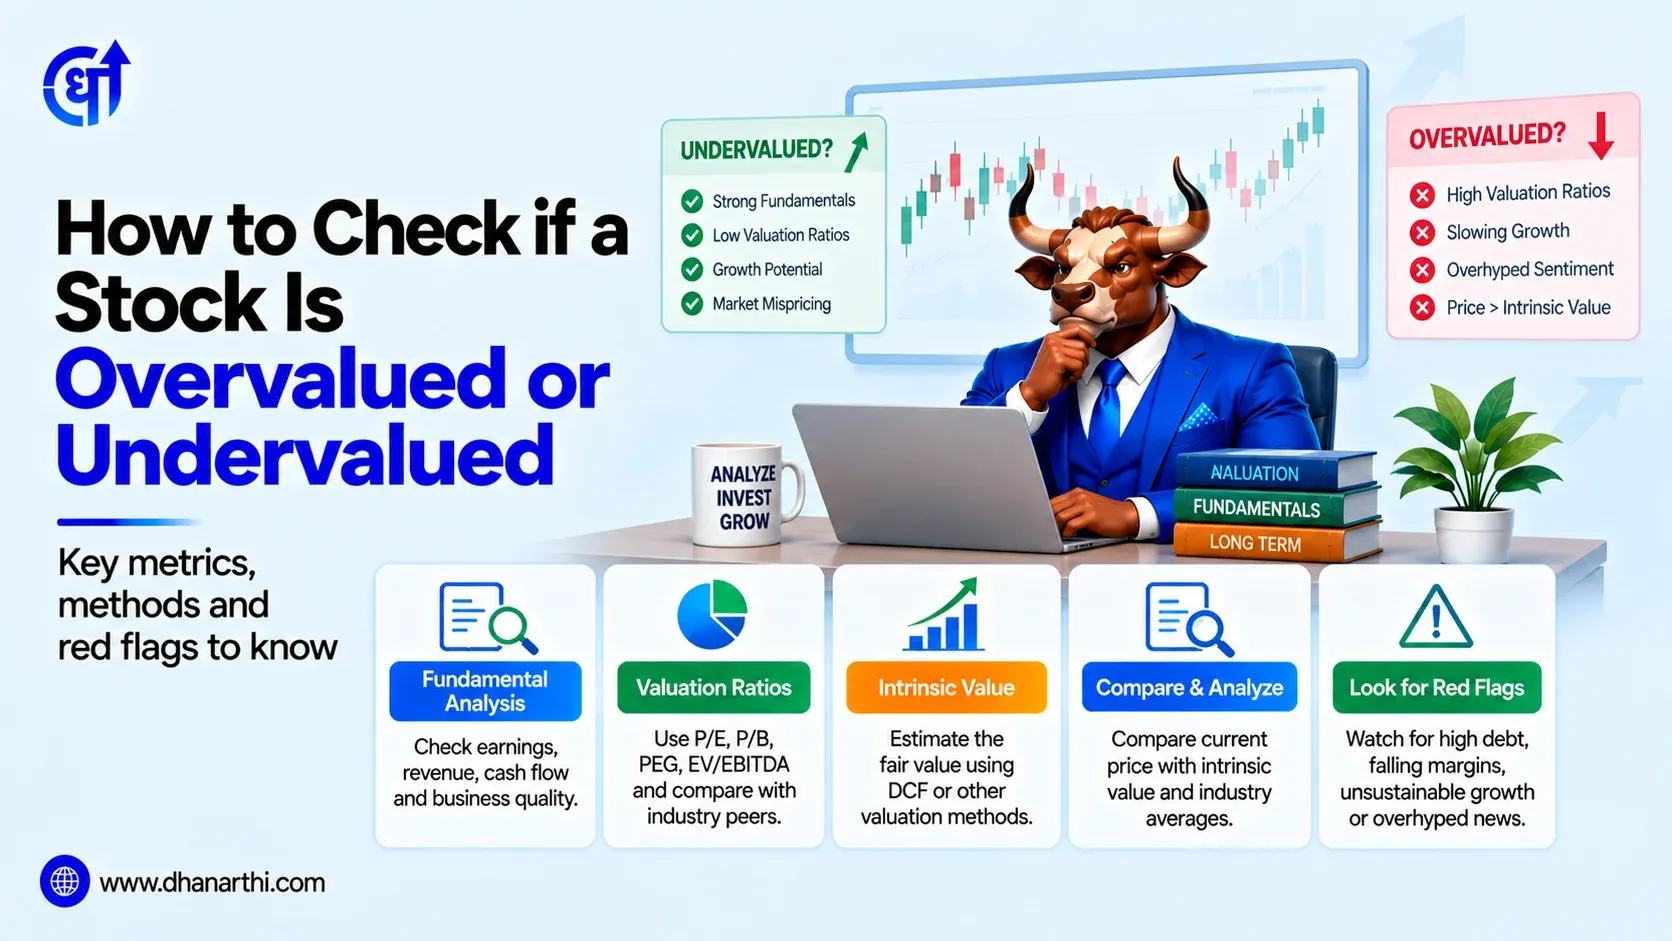
Once a business passes quality and moat checks, the next question is price. Stock valuation analysis attempts to estimate a company's intrinsic value, what the business is genuinely worth based on its cash flows and growth prospects, independent of what the market currently happens to be paying for it.
Comparing intrinsic value to market price reveals whether a stock is trading at a discount, a fair price, or a premium relative to its underlying worth. This comparison is especially useful for smaller, less-covered stocks, since thin analyst coverage means the market price may lag genuine changes in the business for longer than it would for a heavily-tracked large-cap stock. For investors who want an AI-assisted second opinion when working through a company's fundamentals and estimating fair value, the Dhanarthi Stock Guru research assistant can help cross-check a valuation thesis against the underlying financial data.
Even a careful intrinsic value estimate carries uncertainty, growth assumptions can be wrong, and industry conditions can shift. Margin of safety stocks are those purchased meaningfully below their estimated intrinsic value, building in a buffer that protects against being wrong about the exact fair value.
This concept matters more, not less, for lesser-known stocks. Because these companies carry less analyst scrutiny and often trade with wider bid-ask spreads and lower liquidity, the cost of being wrong about a valuation thesis is higher. A meaningful margin of safety, rather than paying right up to a calculated fair value, gives room for error in both the estimate itself and in how the market eventually recognizes the stock's true worth.
This is a distinction worth making explicitly, since it's easy to assume every under-the-radar stock is automatically undervalued. It isn't. A recent industry valuation study found that roughly 63% of companies within India's smallcap segment, representing close to Rs 28 lakh crore in market value, were assessed as overvalued heading into 2026, following a period of strong smallcap returns that outpaced underlying earnings growth.
This is a useful reminder that finding a stock before it becomes popular is not the same exercise as finding a cheap stock. Genuine quality investing requires running the full sequence, business quality, earnings quality, moat, valuation, and margin of safety, together, rather than assuming obscurity by itself is a signal of value. Plenty of under-covered stocks are under-covered for good reason, weak fundamentals that simply haven't attracted enough attention to be widely recognized as weak yet.
Bringing these steps together into a working stock research checklist:
For investors who prefer working through a company's chart and recent price action alongside its fundamentals in one place, Candle Chat provides an interactive way to explore a stock's technical setup while keeping the fundamental checklist above front and center, rather than treating chart-reading and fundamental research as two entirely separate exercises.

Confused about chart patterns & stock analysis?
Use
Dhanarthi Stock Guru
to chat, analyze price patterns, and ask questions directly.
Finding high-quality stocks before they become popular is less about discovering some secret list of hidden names and more about applying a consistent, disciplined process, business quality, earnings quality, competitive moat, valuation, and margin of safety, to companies that simply haven't attracted heavy analyst attention yet. The real edge available to individual investors lies in that analyst coverage gap itself, doing the research that institutional coverage hasn't gotten around to yet. Genuine quality, not obscurity alone, remains the deciding factor between an undiscovered opportunity and an under-covered company that deserved to stay that way.
Disclaimer: This article is for educational purposes only. It does not constitute investment advice. Please consult a SEBI-registered financial advisor before making investment decisions.
1. How do you find high-quality stocks before they become popular?
Finding quality stocks early involves screening for strong business fundamentals, checking earnings quality against real cash flow, identifying a durable competitive advantage, and buying at a price below the stock's estimated intrinsic value with a margin of safety.
2. What is earnings quality analysis?
Earnings quality analysis examines whether a company's reported profit is backed by real, collectible cash flow rather than accounting adjustments, unpaid receivables, or unsold inventory, distinguishing sustainable profit from paper profit.
3. What is a good OCF to PAT ratio for earnings quality?
An Operating Cash Flow to Profit After Tax ratio consistently above 1.0 suggests high-quality, cash-backed earnings, while a ratio below 0.7 can signal that reported profit isn't converting into real cash.
4. Why do small-cap stocks get less attention from analysts?
Small-cap stocks average around 6 analysts covering them compared to 17 for mid-cap and 30 for large-cap stocks, since institutional research coverage generally follows company size and trading liquidity.
5. What is economic moat analysis?
Economic moat analysis evaluates whether a company has a durable competitive advantage, such as a cost advantage, brand strength, network effects, or high switching costs, that protects its profitability from competitors over time.
6. What is the difference between intrinsic value and market price?
Intrinsic value is an estimate of what a business is genuinely worth based on its cash flows and growth prospects, while market price is simply what the stock is currently trading for, and the two can diverge meaningfully for under-covered stocks.
7. What is margin of safety in stock investing?
Margin of safety means buying a stock at a meaningful discount to its estimated intrinsic value, building in a buffer that protects against errors in the valuation estimate or unexpected changes in the business.
8. Does an undiscovered stock always mean it's undervalued?
No, a stock being under-covered by analysts doesn't automatically mean it's cheap, a recent study found a large share of India's smallcap segment was overvalued heading into 2026 despite generally lower analyst coverage.
9. What should be on a fundamental stock analysis checklist?
A practical checklist includes consistent multi-year revenue and profit growth, a healthy OCF to PAT ratio, manageable debt levels, a clear competitive advantage, and a purchase price below estimated intrinsic value.
10. How can I screen for fundamentally strong stocks efficiently?
Using a stock screener that filters by revenue growth, margin trends, debt ratios, and capital efficiency together allows you to narrow a large universe of listed companies down to a shortlist worth deeper individual research.
11. What is business quality analysis?
Business quality analysis looks at a company's operating fundamentals, revenue consistency, margin trends, debt levels, and capital efficiency, to assess the underlying strength of the business itself, separate from its current stock price.
12. Why does cash flow matter more than net profit alone?
Net profit is calculated using accrual accounting and can be affected by non-cash adjustments or delayed collections, while cash flow reflects money that has actually moved through the business, making it a more reliable check on true earnings quality.
Share Market
IPO
Artificial Intelligence
Semi Conductor