





How to Analyse a Company's Revenue Growth
September 24, 2026



TABLE OF CONTENTS
Get AI Summary





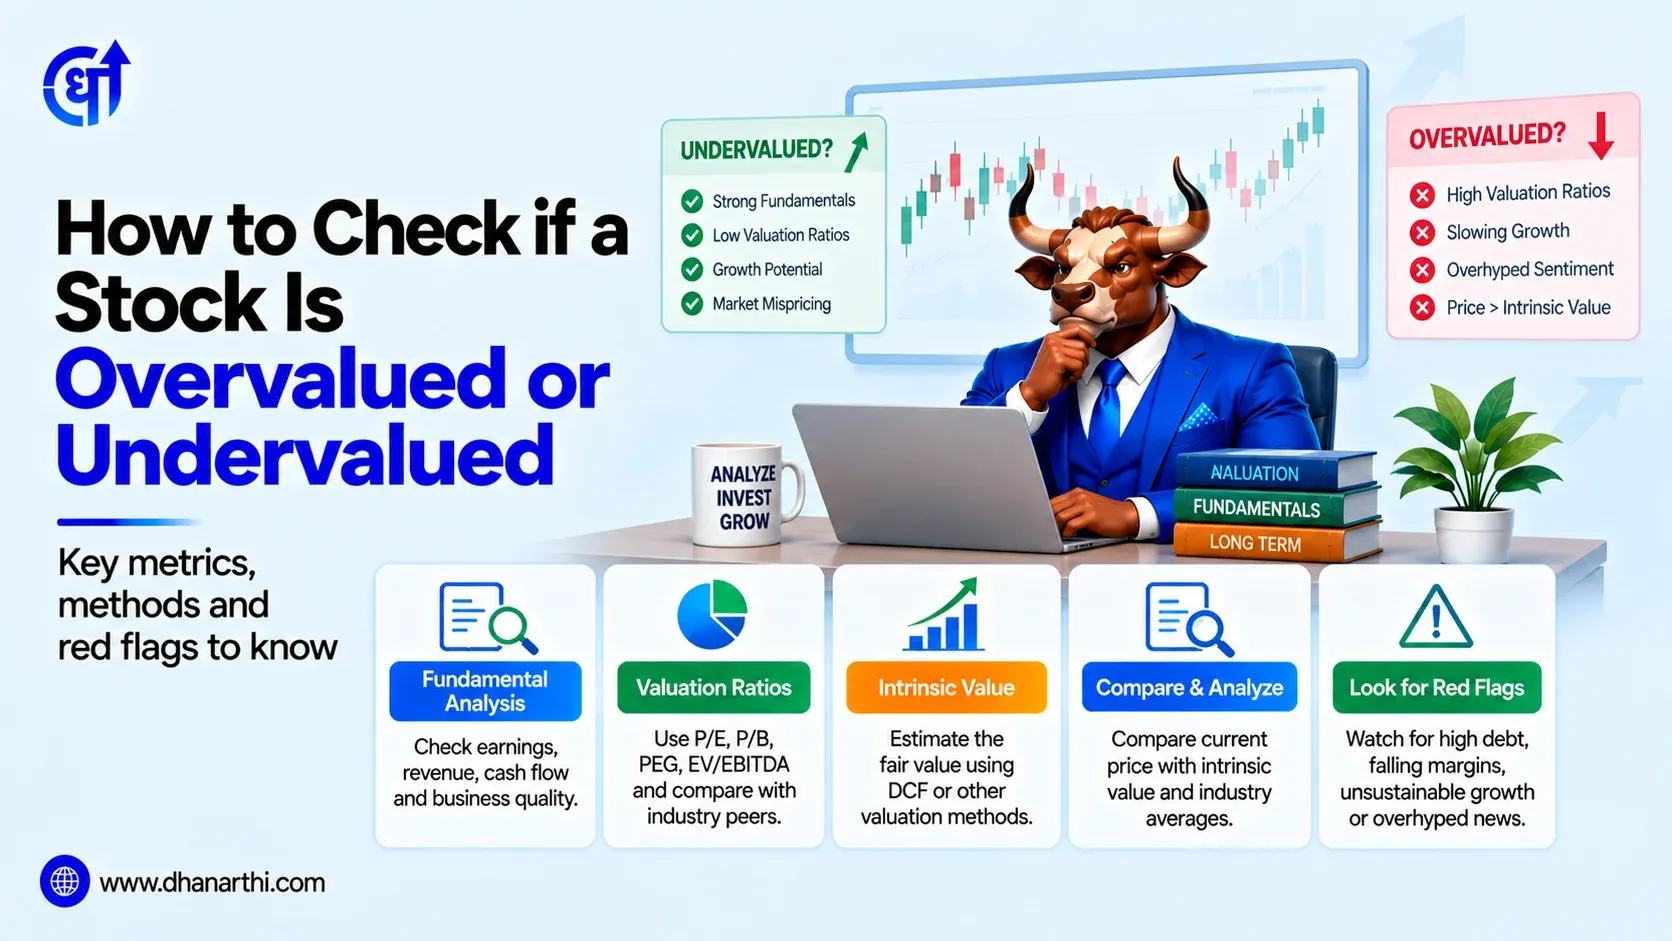
Checking whether a stock is overvalued or undervalued means comparing its current market price against what the underlying business is actually worth, using valuation ratios like PE, PEG, and Price-to-Book, alongside a historical comparison and, where possible, an intrinsic value estimate from discounted cash flow analysis. No single ratio tells the whole story, a stock is best judged by cross-checking several methods together.
A stock is overvalued when its current market price is higher than what its underlying fundamentals, earnings, growth, assets, and cash flow, reasonably justify. A stock is undervalued when the opposite holds, the market price sits below what the business is genuinely worth. Neither label is permanent, a stock's valuation status can shift as its price moves, as new earnings are reported, or as growth expectations change.
Importantly, valuation is always relative to an estimate, not a precise, universally agreed number. Different analysts using different growth assumptions can reach different conclusions about the same stock. This is why checking valuation properly means using multiple methods together and understanding the reasoning behind each one, rather than treating any single ratio as a definitive verdict.
Research Stocks Smarter with Dhanarthi AI Screener
Analyze 5,000+ NSE & BSE stocks with 150+ custom filters, real-time volume breakout scans, and transparent fundamental data.
Use Dhanarthi Screener
The Price-to-Earnings (PE) ratio is the most widely used valuation metric, calculated by dividing a stock's current market price by its earnings per share (EPS). A high PE relative to peers or historical norms can suggest a stock is overvalued, while a low PE can suggest undervaluation, though this needs context to interpret correctly.
Example: If a stock trades at Rs 500 with an EPS of Rs 25, its PE ratio is 500/25, or 20. Whether that 20 is expensive or cheap depends entirely on context, the same PE could be reasonable for a stable, moderate-growth company and expensive for a company with slowing growth or declining margins.
The Dhanarthi Stock Screener lets you compare a stock's PE ratio directly against sector peers and historical levels in one view, rather than manually looking up each comparison point separately.
The PEG ratio refines the PE ratio by factoring in a company's expected earnings growth rate, calculated as PE ratio divided by expected annual earnings growth rate. This adjustment matters because a high PE alone doesn't necessarily mean a stock is overvalued, if the company is growing earnings fast enough, that higher PE may still be reasonable.
Example: A stock with a PE of 30 and expected earnings growth of 30% per year has a PEG ratio of 1.0, generally considered fairly valued. The same PE of 30 with only 10% expected growth gives a PEG of 3.0, a much more expensive signal relative to growth. A PEG below 1.0 is often considered a sign of potential undervaluation relative to growth, though this rule of thumb works better for growth-oriented companies than for mature, slow-growth businesses.
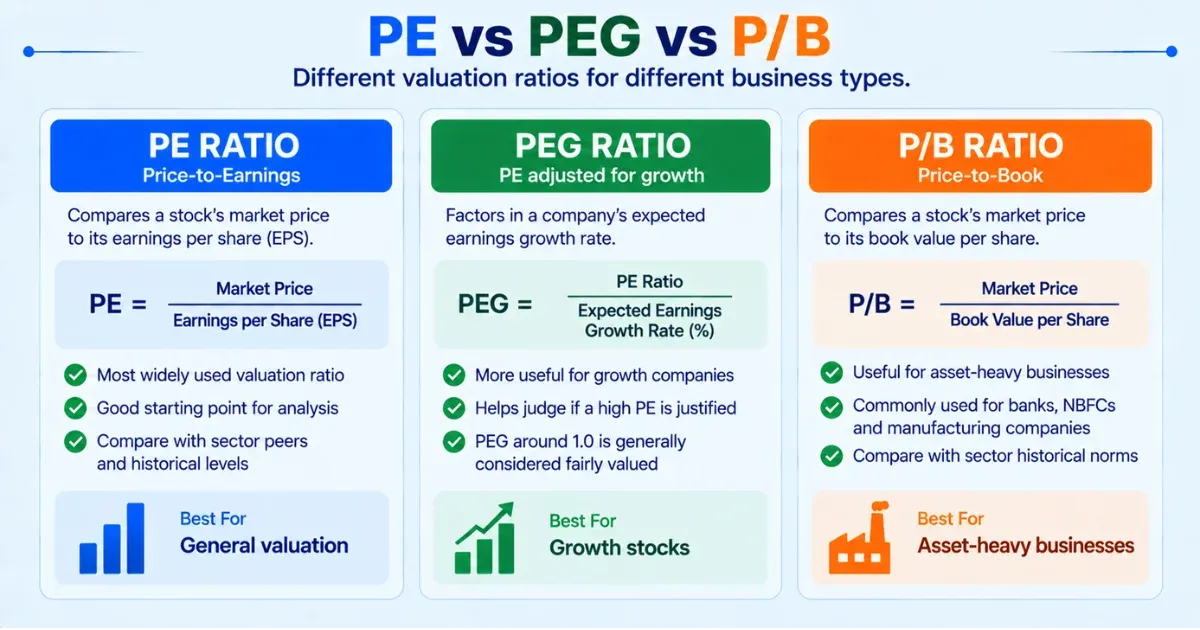
Not every valuation method suits every kind of company equally well. Price-to-Book (P/B) ratio, calculated as market price divided by book value per share, works better for asset-heavy businesses like banks, NBFCs, and manufacturing companies, where the balance sheet itself carries significant value. A P/B ratio meaningfully above historical norms for that specific sector can indicate overvaluation for these asset-heavy businesses.
EV/EBITDA (Enterprise Value to EBITDA) is often preferred over PE for comparing companies with different capital structures or significant debt, since it accounts for both equity and debt in the valuation, and strips out the effect of depreciation, interest, and tax, which can vary widely between companies for reasons unrelated to core operating performance.
Most valuation guides stop at comparing a stock's ratios to its sector peers. A separate, equally useful lens is comparing a stock's, or even a broad index's, current valuation to its own multi-year historical median. This reveals whether today's price is expensive or cheap relative to where that same stock or index has typically traded over time, independent of how peers happen to be priced right now.
How this works in practice: Calculate or look up a stock's PE ratio over the past 5 to 10 years, and find the median value across that period. If the current PE sits meaningfully below this historical median, the stock may be trading cheap relative to its own history, a genuinely different signal than simply being cheap relative to a possibly also-overvalued sector. The reverse holds when current valuation sits well above historical median levels.
| Comparison Method | What It Reveals |
|---|---|
| Peer comparison | How a stock is priced relative to similar companies right now |
| Historical median comparison | How a stock is priced relative to its own typical valuation over time |
| Absolute ratio thresholds | Generic benchmarks (e.g. PE under 15 often considered cheap), least context-specific |
Discounted Cash Flow (DCF) analysis takes a more fundamental approach than ratio comparisons, estimating a company's intrinsic value by projecting its future free cash flows and discounting them back to their present value using an appropriate discount rate. If this calculated intrinsic value sits meaningfully above the current market price, the stock may be undervalued, and vice versa.
DCF requires more assumptions than ratio-based methods, growth rates, discount rates, and terminal value estimates all influence the outcome significantly, which is why small changes in these assumptions can shift the calculated intrinsic value substantially. Because of this sensitivity, DCF works best as one input alongside ratio-based comparisons, rather than as a single definitive number to act on. The Dhanarthi Financial Analysis tool pulls the underlying cash flow and earnings data directly from company filings, making it considerably easier to build and sanity-check a DCF estimate without manually gathering years of financial statements first.
Market history offers a genuinely useful, well-documented illustration of what happens when a stock's price runs far ahead of what its fundamentals could support. Paytm (One97 Communications) listed on Indian exchanges in November 2021 at a price near Rs 1,600, valued at a level many analysts flagged as expensive relative to the company's path to profitability at the time. Within roughly a year, the stock had fallen to around Rs 300, as the market recalibrated its expectations once the gap between price and underlying business performance became harder to ignore.
This example is worth keeping in mind precisely because it shows that overvaluation doesn't correct itself gently, when a stock's price has run well ahead of its fundamentals, the eventual correction can be sharp and painful for investors who bought in near the peak without checking valuation carefully first.
A stock screening cheap on every standard ratio isn't automatically a bargain. A value trap is a stock that looks statistically undervalued but is cheap for a genuine reason, deteriorating fundamentals, a shrinking competitive position, or a structurally challenged industry, rather than simple market mispricing waiting to be corrected.
Distinguishing a genuine bargain from a value trap requires looking beyond the ratio itself and asking why the stock is priced where it is. A company with falling revenue, weakening margins, or rising debt trading at a low PE is very different from a fundamentally sound company temporarily out of favor with the broader market. Checking business quality and earnings trends alongside valuation ratios, rather than screening for cheap ratios alone, is what separates a real opportunity from a trap.

Confused about chart patterns & stock analysis?
Use
Dhanarthi Stock Guru
to chat, analyze price patterns, and ask questions directly.
Checking whether a stock is overvalued or undervalued is rarely a single-number exercise. PE and PEG ratios provide a useful starting point, P/B and EV/EBITDA suit specific business types better, and comparing current valuation to a stock's own historical median adds a dimension most peer-only comparisons miss entirely. A DCF-based intrinsic value estimate, treated as one input rather than gospel, rounds out the picture. Above all, checking why a stock is priced where it is, rather than reacting to a ratio in isolation, is what separates genuine valuation insight from a screening exercise that misses value traps and overpriced popular stocks alike.
Disclaimer: This article is for educational purposes only. It does not constitute investment advice. Please consult a SEBI-registered financial advisor before making investment decisions.
1. How do I check if a stock is overvalued or undervalued?
Check a stock's valuation by comparing its PE, PEG, and Price-to-Book ratios against sector peers and its own historical median, and where possible, estimate intrinsic value using discounted cash flow analysis.
2. How do I know if a stock is undervalued?
A stock may be undervalued if its valuation ratios sit meaningfully below sector peers and its own historical median, provided the low valuation reflects market mispricing rather than genuinely weakening fundamentals.
3. How do I know if a stock is overvalued?
A stock may be overvalued if its PE, PEG, or other valuation ratios sit well above sector peers and historical norms, especially if the company's growth or fundamentals don't justify that premium.
4. What is a good PE ratio for a stock?
There is no universal good PE ratio, it depends on the company's growth rate, sector, and how its current PE compares to both peers and its own historical median levels.
5. What is the PEG ratio and why does it matter?
The PEG ratio divides the PE ratio by expected earnings growth rate, adjusting valuation for growth. A PEG around 1.0 is often considered fairly valued, while a PEG well above 1.0 suggests a stock may be expensive relative to its growth.
6. What is a value trap?
A value trap is a stock that appears statistically cheap on valuation ratios but is priced low for a genuine reason, such as deteriorating fundamentals or a weakening competitive position, rather than simple market mispricing.
7. What is DCF valuation and how does it work?
Discounted Cash Flow (DCF) valuation estimates a company's intrinsic value by projecting its future free cash flows and discounting them back to present value, offering a more fundamental valuation anchor than ratio comparisons alone.
8. Why compare a stock's valuation to its own historical median?
Comparing to historical median reveals whether a stock is expensive or cheap relative to its own typical valuation over time, a distinct and useful signal separate from comparing only against current sector peers.
9. Is Price-to-Book a good valuation metric for all stocks?
Price-to-Book works best for asset-heavy businesses like banks and NBFCs, where balance sheet value is significant, and is less useful for asset-light businesses like software or services companies.
10. Can a cheap stock still be a bad investment?
Yes, if a stock's low valuation reflects genuinely deteriorating fundamentals rather than temporary market mispricing, it may be a value trap rather than a genuine bargain.
11. What real example shows the risk of buying overvalued stocks?
Paytm listed near Rs 1,600 in 2021 at a valuation many analysts considered expensive, and the stock fell to around Rs 300 within about a year as the market corrected the gap between price and business fundamentals.
12. Should I rely on just one valuation ratio to decide?
No, using multiple valuation methods together, PE, PEG, P/B or EV/EBITDA depending on the business type, and historical comparison, gives a more reliable picture than relying on any single ratio in isolation.
Share Market
IPO
Artificial Intelligence
Semi Conductor