




How to Analyse a Company's Revenue Growth
September 24, 2026



TABLE OF CONTENTS
Get AI Summary





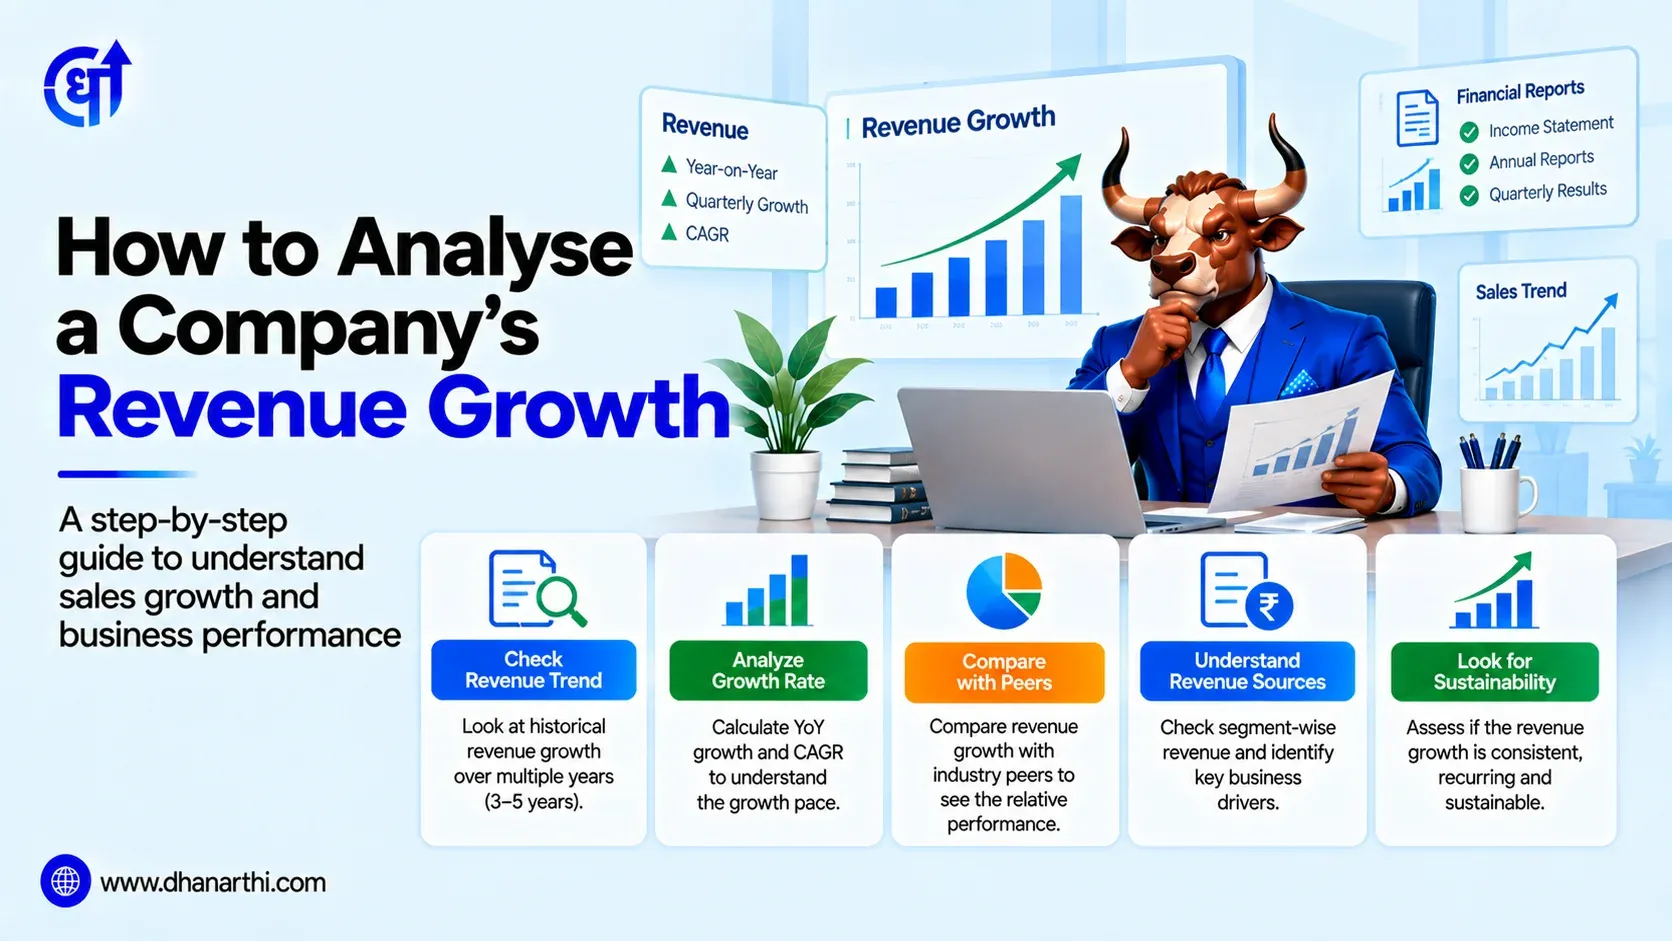
Analysing a company's revenue growth means looking beyond the headline percentage to check how that growth was measured (YoY, QoQ, or TTM), whether it came from the core business or from acquisitions, and whether it's actually translating into profit and cash flow. A single growth number in isolation tells you very little, the method behind it and what's driving it matter just as much as the figure itself.
Revenue growth analysis is often treated as a simple headline check, did the top line go up or down, but the number carries far more weight than that surface read suggests. Revenue is the starting point every other line on the income statement flows from, and consistent, genuine revenue growth is one of the clearest signals that a company's core business is expanding rather than merely being managed for short-term profit optics.
A real, current illustration of how closely markets watch this makes the point well. Infosys reported FY26 revenue of $20,158 million, up 4.6% year-on-year in reported terms, but only 3.1% in constant currency terms, and set FY27 guidance at a 1.5% to 3.5% constant currency growth range. As IT sector bellwethers, TCS and Infosys results commonly move the broader Nifty IT index by 2% to 3% around their quarterly announcements, since their guidance signals what the rest of the sector might expect. This is a useful reminder that revenue growth numbers aren't just an accounting detail, they actively shape how the market prices an entire sector.
Research Stocks Smarter with Dhanarthi AI Screener
Analyze 5,000+ NSE & BSE stocks with 150+ custom filters, real-time volume breakout scans, and transparent fundamental data.
Use Dhanarthi Screener
The basic revenue growth rate formula is straightforward:
Revenue Growth Rate (%) = [(Current Period Revenue - Prior Period Revenue) / Prior Period Revenue] x 100
Example: If a company reported Rs 500 crore in revenue last year and Rs 575 crore this year, the growth rate is [(575 - 500) / 500] x 100 = 15%. This same formula applies whether comparing quarters, years, or any other matching time periods, as long as both figures cover comparable periods of the same length.
While the formula itself is simple, the comparison period chosen, and what's included or excluded from each period's revenue figure, changes the story the number tells substantially, which is where more careful analysis comes in.
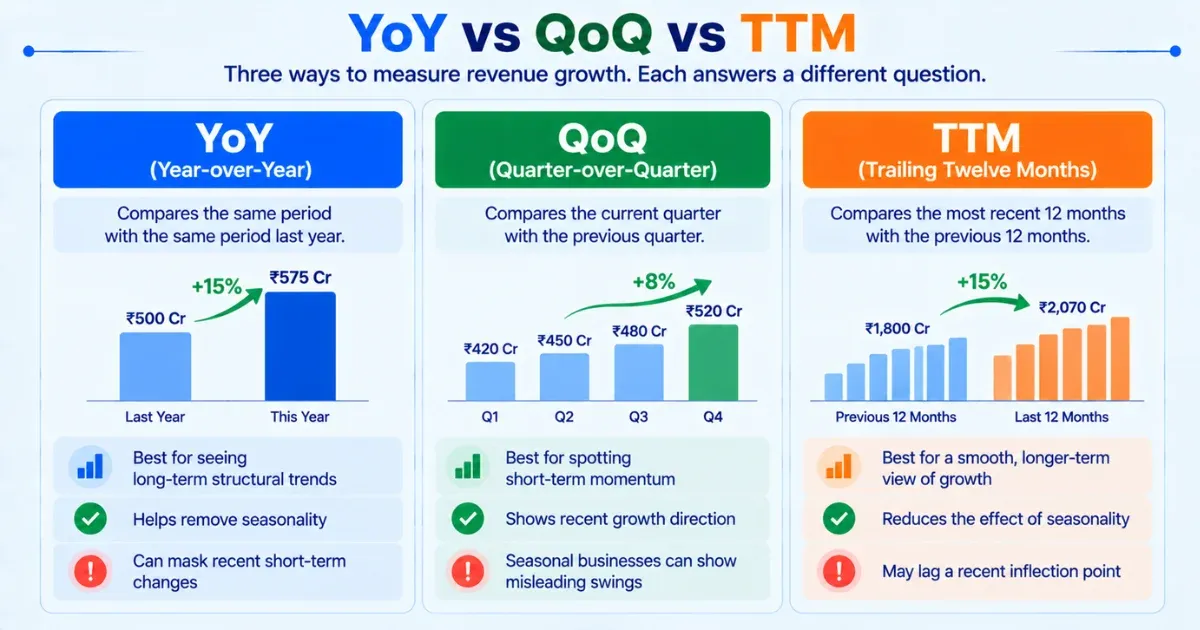
Three common comparison windows are used to measure revenue growth, and each answers a distinctly different question.
| Metric | Compares | Best For | Watch Out For |
|---|---|---|---|
| YoY (Year-over-Year) | Same period vs one year earlier | Structural, longer-term trend, removes seasonality | Can mask a recent acceleration or slowdown within the year |
| QoQ (Quarter-over-Quarter) | Current quarter vs immediately preceding quarter | Spotting short-term momentum shifts | Seasonal businesses can show misleading swings |
| TTM (Trailing Twelve Months) | Most recent 12 months vs the prior 12-month period | Smoothing out seasonality while staying current | Can lag a genuine recent inflection point |
Relying on just one of these can give a distorted picture. A company might show an impressive QoQ jump driven entirely by seasonal demand, while its YoY growth reveals a much more modest underlying trend. Checking at least YoY and QoQ together, and using TTM for a smoothed longer-term read, gives a fuller picture than any single metric in isolation.
This distinction is one of the more overlooked aspects of revenue growth analysis, yet it directly affects how repeatable that growth actually is. Organic growth comes from a company's existing operations, more customers, higher prices, expanded product lines, without buying another company to get there. Inorganic growth comes from mergers and acquisitions, where revenue jumps because a new entity's sales are now consolidated into the parent company's books.
Organic Growth Formula: Organic Revenue Growth % = (Current Revenue excluding acquired entities - Prior Revenue excluding acquired entities) / Prior Revenue excluding acquired entities
Example: A company grew total revenue from Rs 500 crore to Rs 575 crore, a 15% increase. If Rs 45 crore of that increase came from a business it acquired during the year, the organic growth, stripping out the acquisition, is only (530 - 500) / 500 = 6%. The remaining 9 percentage points came from the acquisition, not the core business genuinely expanding on its own.
Investors and analysts generally value organic growth more highly than inorganic growth, since it reflects genuine operational strength and tends to be more repeatable without continuously deploying fresh acquisition capital.
For companies with significant overseas revenue, particularly IT services firms billing largely in US dollars, currency movements can distort the reported growth rate. Constant currency growth removes this distortion by converting both the current and prior period's revenue using the same fixed exchange rate, isolating how much growth came from actual business activity versus currency fluctuation alone.
This is exactly why the Infosys example cited earlier showed two different growth figures for the same quarter, reported revenue growth benefited from currency movements, while the constant currency figure of 3.1% reflected the underlying business performance more accurately. For any company with substantial export or foreign-currency revenue, checking the constant currency growth figure alongside the reported figure is a more reliable way to judge genuine business momentum.
Not all revenue growth is equally durable. Growth achieved through heavy discounting, unsustainable customer acquisition spending, or below-cost pricing to win market share can show up as an impressive top-line number while quietly damaging the business's long-term health. Checking a few supporting signals alongside the headline growth number helps separate durable growth from growth that's effectively being bought at a cost.
Signs worth checking include whether gross and operating margins are holding steady or improving alongside revenue growth, whether receivables are growing in line with revenue or ballooning faster (a sign customers aren't paying on time), and whether the growth rate has been consistent across several recent quarters rather than driven by one unusually large, one-off order.
A company can grow revenue significantly while profit grows much more slowly, stays flat, or even declines, and this divergence is worth investigating rather than glossing over. This can happen when a company is discounting heavily to drive sales volume, absorbing rising input costs without passing them on through price increases, or investing heavily in growth initiatives that haven't yet started paying off in margin terms.
Comparing revenue growth against profit growth side by side over several quarters reveals whether a company's growth strategy is genuinely working or whether it's essentially trading margin for market share, a strategy that can make sense temporarily but isn't sustainable indefinitely without eventually showing up in improved profitability.
Companies, especially larger ones like IT services majors, typically provide forward-looking revenue growth guidance alongside their quarterly results. This guidance reflects management's own expectation for the upcoming period or year and often moves the stock, and sometimes the broader sector, more than the reported historical numbers themselves.
Guidance should be read as a range reflecting management's confidence level, not a guaranteed outcome, and it's worth tracking whether a company has historically met, missed, or exceeded its own prior guidance, since a track record of realistic guidance carries more weight than an optimistic-sounding number from a company that regularly falls short of its own targets. Reviewing this alongside actual quarterly results over time builds a clearer picture of how reliable a specific management team's forward guidance tends to be.
Running these checks manually across a company's several years of quarterly filings takes real time. The Dhanarthi Financial Analysis tool pulls this data directly from company filings, and the Dhanarthi Stock Screener lets you filter and compare revenue growth trends across companies in one place, rather than piecing figures together manually from each individual quarterly report.

Confused about chart patterns & stock analysis?
Use
Dhanarthi Stock Guru
to chat, analyze price patterns, and ask questions directly.
Analysing a company's revenue growth properly means going well beyond the single headline percentage most people stop at. Checking YoY, QoQ, and TTM figures together, separating organic from inorganic growth, adjusting for currency where relevant, and comparing revenue growth against profit growth and receivables trends all reveal whether reported growth reflects genuine, durable business strength or something more fragile. As IT sector results consistently demonstrate, the market reacts as much to the quality and guidance behind a growth number as to the number itself, and building the habit of checking both is what separates surface-level analysis from a genuinely useful read on a company's trajectory.
1. How do you analyse a company's revenue growth?
Analyse revenue growth by checking YoY, QoQ, and TTM comparisons together, separating organic growth from acquisition-driven growth, adjusting for currency effects where relevant, and comparing it against profit growth and margin trends.
2. What is the formula for revenue growth rate?
Revenue growth rate is calculated as [(Current Period Revenue minus Prior Period Revenue) divided by Prior Period Revenue] multiplied by 100, expressed as a percentage.
3. What is the difference between YoY and QoQ revenue growth?
YoY (Year-over-Year) compares a period to the same period one year earlier, revealing structural trends free of seasonality. QoQ (Quarter-over-Quarter) compares consecutive quarters, better for spotting short-term momentum shifts.
4. What is organic vs inorganic revenue growth?
Organic revenue growth comes from a company's existing operations without acquisitions, while inorganic growth comes from mergers and acquisitions adding new revenue streams to the consolidated business.
5. Why does organic vs inorganic growth matter for investors?
Organic growth reflects genuine, repeatable operational strength, while inorganic growth depends on continued acquisition activity, making the split important for judging how sustainable a company's reported growth actually is.
6. What is constant currency revenue growth?
Constant currency growth removes the effect of exchange rate fluctuations by converting current and prior period revenue at the same fixed exchange rate, isolating genuine business growth from currency movements.
7. Why is constant currency growth important for IT companies?
IT services companies bill heavily in foreign currencies like the US dollar, so currency movements can distort reported growth figures, making constant currency growth a more accurate measure of underlying business performance.
8. Can revenue grow while profit declines?
Yes, this can happen when a company grows revenue through heavy discounting, rising costs it hasn't passed on through pricing, or increased spending on growth initiatives, all of which can compress margins even as the top line rises.
9. How do I know if a company's revenue growth is sustainable?
Check whether margins are holding steady alongside revenue growth, whether receivables are growing in line with sales rather than faster, and whether growth has been consistent across several quarters rather than driven by a one-off event.
10. What is TTM revenue growth?
TTM (Trailing Twelve Months) revenue growth compares the most recent 12 months of revenue against the prior 12-month period, smoothing out seasonal fluctuations while staying more current than a full fiscal year comparison.
11. Why does management guidance on revenue growth matter?
Management guidance reflects the company's own forward expectations and often moves the stock price significantly, especially for sector bellwethers, making it worth tracking alongside a company's historical accuracy in meeting its own past guidance.
12. What is a good revenue growth rate for a company?
There is no universal benchmark, a good revenue growth rate depends on the company's industry, size, and stage of growth, and is best judged relative to sector peers and the company's own historical growth trend.
Share Market
IPO
Artificial Intelligence
Semi Conductor