


How to Analyse Cash Flow Statement for Stock Picking
June 11, 2026

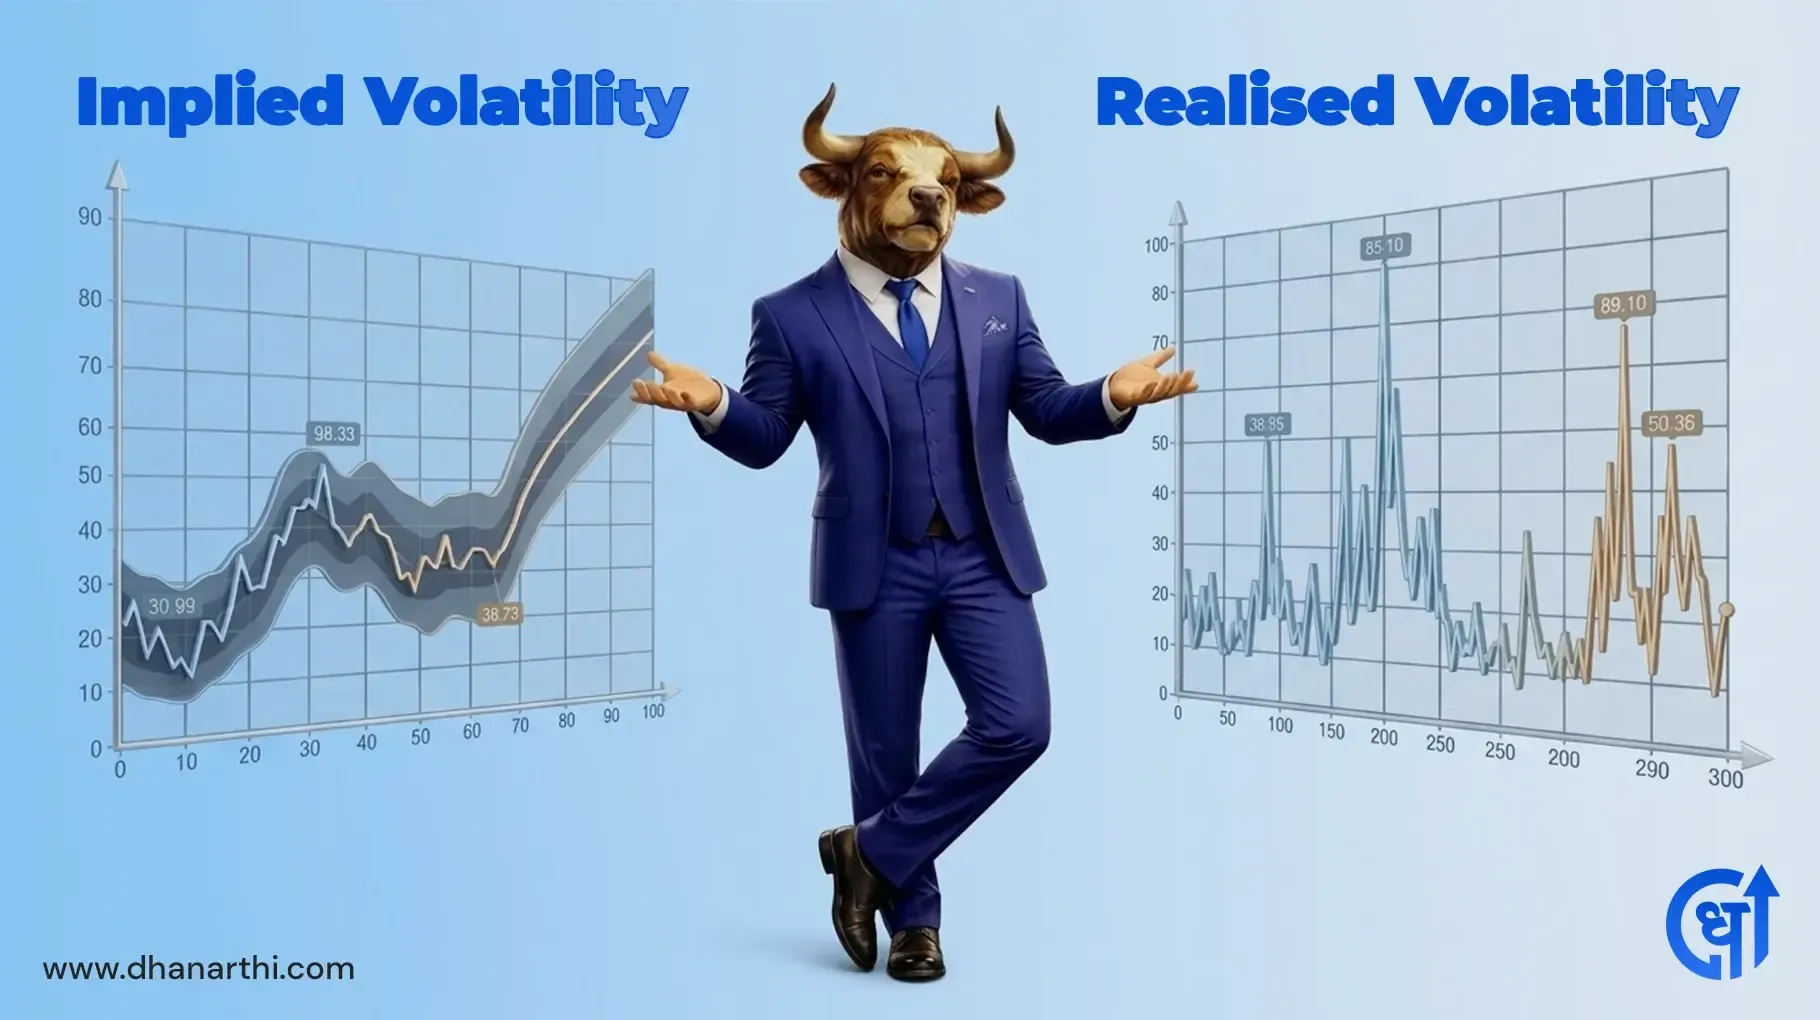
TABLE OF CONTENTS
Get an AI Summary of This Post Using The Tools Below.


Most options traders spend all their time trying to predict market direction. Up or down. Bull or bear. But here is something I have noticed over the years: the traders who consistently make money are not just watching price. They are watching historical volatility vs implied volatility. Understanding this one comparison can completely shift how you approach every options trade you place. If you are new to reading market data and want a solid foundation first, this guide on beginner to pro ratio financial technical analysis is a great place to start.
In this article, I will break down what historical volatility and implied volatility actually mean, show you the key differences, and explain how the gap between them can help you decide whether to buy or sell options. Whether you are just starting out or have been trading Nifty options for a while, this guide is written to make things genuinely simple.
Before comparing the two, you need to understand each one separately. Most people struggle with this part, so let me explain it as simply as possible.
Historical volatility is a measure of how much a stock or index has actually moved in the past. No predictions, no guesses. Just the real, recorded movement of price over a specific time period, usually 10, 20, or 30 days.
Here is a simple way to think about it. If Nifty moved an average of 1 percent per day over the last 30 days, that 1 percent is roughly your historical volatility for that period. It tells you what actually happened in the market. Nothing more, nothing less.
In my experience, most beginners ignore this number completely. That is a mistake. HV gives you a factual baseline against which you can measure everything else.
The formula looks like this:
HV = Standard Deviation of daily returns x Square root of 252
Here is what each part means:
You do not need to calculate this by hand. Most broker platforms and screener tools display it for you. But knowing what it represents helps you use it correctly. To go deeper into how numbers like these are used in stock research, check out this guide on quantitative analysis.
Now here is where things get more interesting. Implied volatility (IV) is not based on past data at all. It is the market's expectation of future volatility, and it is derived directly from current option prices.
Think of IV like an insurance premium. The higher the uncertainty in the market, the more people are willing to pay for options. That higher price signals higher implied volatility. When things are calm, options become cheaper, and IV drops.
Here is something interesting: IV does not tell you which direction the market will move. It only tells you how much movement the market expects. That distinction matters a lot when building a strategy.
A real-world example of this is India VIX. To understand exactly what India VIX is and how it is tracked, this dedicated article on India VIX explains it clearly. When India VIX spikes, it means the options market is pricing in big moves ahead. When it is low and flat, the market expects relatively calm conditions.
IV does not have a direct standalone formula the way HV does. Instead, it is calculated by reverse-engineering the Black-Scholes options pricing model.
Think of it this way: in the Black-Scholes formula, if you plug in all the known variables, including the stock price, strike price, time to expiry, and interest rate, the only unknown left is volatility. When you take the current market price of an option and solve for that unknown, the number you get is the implied volatility.
IV = Solve for volatility using current option price in Black-Scholes model
Again, you do not need to do this manually. Your broker's options chain will show IV for every strike and expiry. Platforms that help with market data and stock research, like Dhanarthi's Analyze financial reports, make it easier for everyday investors to access and interpret these numbers without needing a finance degree.
Now that you understand both individually, let us put them side by side. This is where it all starts to click.
| Feature | Historical Volatility | Implied Volatility |
|---|---|---|
| Based on | Past price data | Current option prices |
| Looks at | What happened | What market expects |
| Calculated using | Standard deviation | Options pricing model |
| Used for | Benchmarking actual movement | Strategy selection |
| Data source | Price history | Live options chain |
The key point here is that one looks backward and one looks forward. Neither is right or wrong. They serve different purposes, and using both together is where the real insight comes from.
(Insert image here: Line chart with IV above HV line over a 6-month period) ALT text: "Historical vs implied volatility chart showing volatility risk premium in Nifty"
If you plot historical volatility and implied volatility on the same chart, you will almost always notice that the IV line sits above the HV line. This gap between the two lines has a name: the volatility risk premium.
This premium exists because option sellers demand extra compensation for the uncertainty of the future. The market consistently overpays for protection. That consistent overpricing is exactly what creates structural opportunity for sellers.
Here is the reality: the gap between implied volatility vs historical volatility is not just an interesting observation. It is a tradeable signal. Let me walk you through both scenarios.
This is the most common condition in markets. IV is almost always higher than HV, which means options are priced higher than what actual movement justifies.
What does this mean for you? It means you are being offered more premium than the market's actual movement warrants. Option sellers, those who write calls or puts or sell spreads, collect that excess premium. Over time, if IV consistently exceeds realized movement, sellers have a structural advantage.
A practical example: Suppose Bank Nifty's 30-day historical volatility is sitting at 14 percent but the at-the-money options are implying 20 percent volatility. The market is pricing in more fear than history justifies. A disciplined seller can collect that extra premium and profit if the actual movement stays closer to 14 percent.
This condition is tied directly to the concept of the volatility risk premium, which is the persistent tendency of IV to exceed actual realized volatility over time. Understanding how open interest moves alongside IV can give you an even clearer picture of where smart money is positioned.
This scenario is rarer, but it does happen. When actual market movement is running hotter than what options are pricing in, options are cheap relative to real movement.
This can occur during sudden regime changes. Think about what happened during the COVID crash, or during sharp reactions to a Union Budget announcement or a global banking shock. In those moments, the market moved faster than options had priced in, and option buyers who held positions made significant gains.
If you spot a situation where the historical volatility index reading is significantly above current IV, it may signal that options are underpriced. Buyers have an edge in that environment.
Knowing the theory is good. Knowing how to act on it is better. Here is a simple 3-step process I follow before placing any options trade.
Step 1: Check Current Implied Volatility
Look at India VIX for Nifty-based trades. For individual stocks, check the IV column on your broker's options chain. This tells you what the market is currently expecting.
Step 2: Compare with 30-Day Historical Volatility
Pull up the 30-day historical volatility for the same underlying. Most charting platforms and broker tools display this. If you want a clean place to compare this data alongside other technical signals, this guide on technical analysis principles, charts, and indicators can help you build a more complete pre-trade checklist.
Step 3: Decide Based on the Gap
One important note here: this comparison is one input, not a complete strategy. Always consider market trend, event risk, and your own risk appetite before placing any trade. To better understand how options positions and their sensitivities work alongside volatility, the guide on option greeks is well worth reading before you place your next trade.
For deeper research into individual stocks alongside your volatility analysis, the Dhanarthi Deep Scan AI stock research tool can help you layer in additional data before committing to any position.
The comparison between historical volatility vs implied volatility is one of the most practical tools in an options trader's toolkit. HV tells you what the market has done. IV tells you what the market expects. The gap between them is where real trading decisions live.
Use this comparison consistently, not occasionally. Build it into your pre-trade checklist alongside your chart analysis and risk management. And remember: this is a tool, not a guarantee. Markets can surprise even the most prepared traders.
If you are building your options knowledge and want a platform that makes fundamentals of stock analysis and market data more accessible, Dhanarthi Screener is worth checking out. Start simple, stay consistent, and let the data guide your decisions.
1. What is the difference between implied volatility and historical volatility?
Historical volatility measures how much a stock actually moved in the past, using price data and standard deviation. Implied volatility shows what the options market expects in the future, based on current option prices. One looks backward, the other looks forward. Both are useful tools for options traders.
2. How do you read a historical volatility vs implied volatility chart?
On this chart, you will see two lines plotted over time. The IV line usually sits above the HV line. The gap between them is called the volatility risk premium. When the gap is wide, options are expensive. When it narrows, options are closer to fair value based on actual market movement.
3. What does it mean when implied volatility is higher than historical volatility?
It means the options market is pricing in more future movement than history actually shows. For option sellers, this is a favorable condition. They collect extra premium that may not be justified by real movement. Over time, this gap, known as the volatility risk premium, tends to benefit sellers consistently.
4. What is the historical volatility formula used in options trading?
The basic formula is: HV equals the standard deviation of daily returns multiplied by the square root of 252. Here, 252 represents the number of trading days in a year. This annualizes the number so you can compare it with implied volatility, which is also expressed as an annualized percentage figure.
5. How is implied volatility calculated from option prices?
Implied volatility does not have a direct formula. It is found by reverse-engineering the Black-Scholes pricing model. You plug in all known variables like stock price, strike price, and time to expiry, then solve for the one unknown left, which is volatility. The result is the current implied volatility reading.
6. What is India VIX and how does it relate to implied volatility in options?
India VIX is the implied volatility index for Nifty 50 options. It shows how much volatility the options market expects over the next 30 days. When India VIX rises sharply, options become more expensive. Traders use it as a quick way to check overall market fear before building any options position.
7. When should an options trader prefer buying over selling based on volatility?
If historical volatility is running higher than implied volatility, options are relatively cheap. In this case, buyers have an advantage because actual movement may exceed what the option price reflects. This situation is uncommon but tends to happen during sudden market shocks or unexpected events in Indian markets.
8. What is the volatility risk premium and why does it matter for traders?
The volatility risk premium is the persistent gap where implied volatility stays higher than actual realized volatility over time. It exists because option sellers demand extra compensation for future uncertainty. For disciplined sellers, this premium is a source of consistent edge, especially in calm or range-bound market conditions.
9. How can I use historical implied volatility data to improve my options strategy?
Compare the current implied volatility with 30-day historical volatility for the same stock or index. If IV is much higher, selling premium makes sense. If they are close or HV is higher, buying may offer better value. This simple check adds useful context before every trade you place.
10. Is historical volatility the same as realized volatility in options trading?
Yes, in most practical contexts, historical volatility and realized volatility refer to the same thing. Both measure how much a stock or index actually moved over a past period. Some traders use realized volatility specifically to compare against implied volatility after expiry, to see how well the options market predicted real movement.
Share Market
IPO
Artificial Intelligence
Semi Conductor