





Best Oil & Gas Stocks in India 2026: Top Picks Compared
November 3, 2026


TABLE OF CONTENTS
Get AI Summary



The best oil gas stocks India investors track in 2026 include Reliance Industries, ONGC, Indian Oil Corporation, BPCL and Oil India. These companies dominate exploration, refining and marketing. Reliance leads with a market cap above Rs 17 lakh crore, while upstream names like ONGC trade at single-digit PE ratios near 6.8.
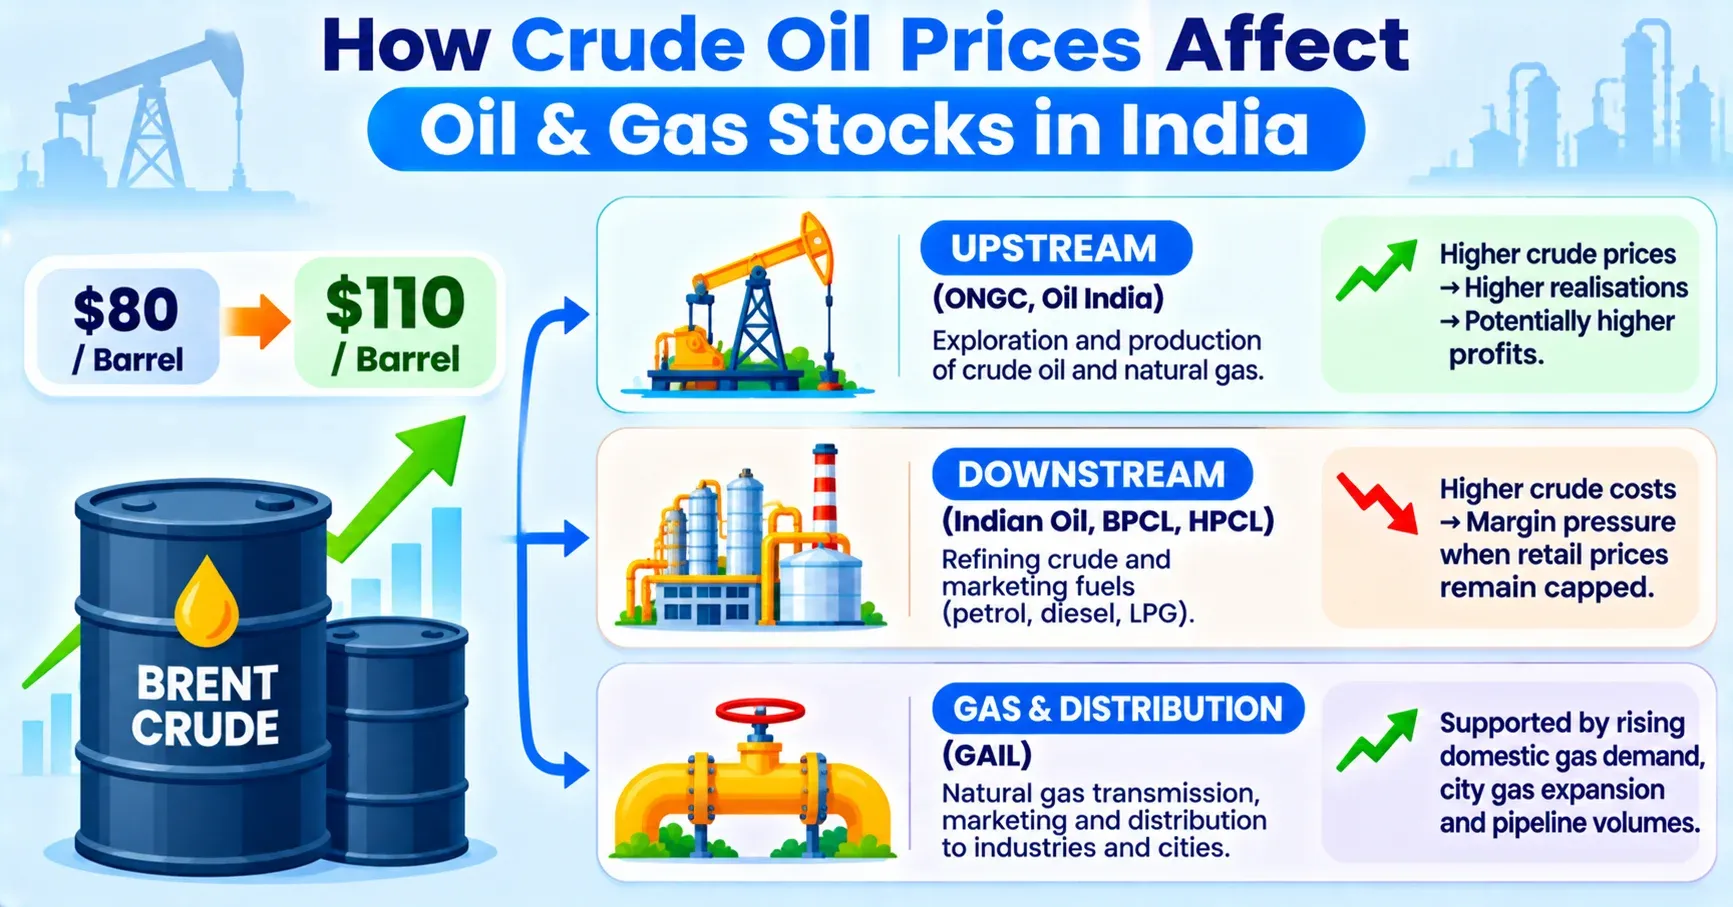
Oil and gas stocks form a core part of the Indian energy sector. They cover upstream producers that extract crude and gas, refiners that process it, and marketers that sell fuel to consumers. Crude oil prices, government policies on retail fuel, and global supply disruptions drive their earnings. In November 2026, Brent crude hovered near $110 a barrel, creating different impacts for upstream and downstream companies.
This article compares the leading oil and gas stocks using real data from NSE, BSE and company filings. It covers market capitalisation, valuation multiples, profitability and dividend yields as of early November 2026. Beginners can use this to understand the sector before running their own screens.
India imports over 85 percent of its crude oil needs according to government data. Domestic producers and refiners therefore play a strategic role in energy security. The sector includes large public sector units such as ONGC, Indian Oil, BPCL and HPCL, plus private player Reliance Industries. Natural gas distribution companies like GAIL and city gas firms add another layer of demand growth.
Earnings of upstream companies rise with higher crude realisations. Refiners and oil marketing companies (OMCs) face pressure when retail prices stay capped while input costs climb. Investors need to separate these business models rather than treat the whole sector as one bet. A rise in Brent from $80 to $110 can add meaningful profit for ONGC while squeezing OMC marketing margins if pump prices do not adjust fully.
A common investor mistake is buying OMC stocks purely on low PE without checking under-recoveries on LPG or diesel. During high crude periods these can erase reported profits. Checking both valuation and the underlying margin drivers reduces this risk. Another frequent error is ignoring debt levels. HPCL’s higher leverage makes it more sensitive to interest rate or margin swings than lower-debt names like GAIL.
Research Stocks Smarter with Dhanarthi AI Screener
Analyze 5,000+ NSE & BSE stocks with 150+ custom filters, real-time volume breakout scans, and transparent fundamental data.
Use Dhanarthi Screener
The table below lists key metrics for the largest oil and gas companies as of 2 November 2026. Figures come from exchange data and financial aggregators that source NSE and BSE filings.
| Company | Market Cap (Rs Cr) | Price (Rs) | PE Ratio | ROE (%) | Dividend Yield (%) | Debt to Equity |
|---|---|---|---|---|---|---|
| Reliance Industries | 17,59,230 | 1,300 | 21.4 | 8.8 | 0.5 | 0.44 |
| ONGC | 2,95,423 | 235 | 6.8 | 11.6 | 5.6 | 0.47 |
| Indian Oil Corporation | 1,83,788 | 135 | 3.9 | 19.2 | 6.1 | 0.60 |
| BPCL | 1,23,604 | 293 | 8.0 | 15.6 | 6.8 | 0.62 |
| GAIL (India) | 1,10,403 | 177 | 8.8 | 8.7 | 4.5 | 0.19 |
| Oil India | 73,848 | 462 | 9.0 | 12.7 | 2.5 | 0.59 |
| HPCL | 72,463 | 348 | 51.5 | 2.7 | 7.0 | 1.40 |
Data sourced from NSE, BSE and Simply Wall St. Last updated: November 2026.
Reliance Industries dominates the list by size. Its market capitalisation reached Rs 17.59 lakh crore on 2 November 2026 (Source: stockanalysis.com and NSE). The PE stood at 21.4 while ROE was 8.76 percent. The lower ROE reflects its diversified operations across energy, retail and telecom. Net income for the trailing period was around Rs 82,110 crore.
ONGC, the largest pure upstream player, produced about 73 percent of India’s crude oil and 57 percent of its natural gas in recent periods (Source: company filings via Screener.in). Its PE of 6.8 and ROE of 11.6 percent look attractive relative to the market. Dividend yield reached 5.6 percent.
Indian Oil and BPCL trade at single-digit PE ratios of 3.9 and 8.0 respectively. Their ROE figures of 19.2 percent and 15.6 percent are higher, yet both face LPG under-recovery risks when crude stays elevated. HPCL shows a stretched PE of 51.5 and low ROE of 2.7 percent, reflecting recent margin pressure.
Reliance Industries remains the largest energy company by market value. Its refining and petrochemical complex at Jamnagar processes millions of tonnes of crude annually. The company also holds significant stakes in retail and digital businesses that cushion pure energy volatility.
In the latest available figures, Reliance reported revenue of Rs 11.99 trillion and EPS of Rs 60.68 on a trailing basis (Source: stockanalysis.com, November 2026). Analysts set a target price near Rs 1,666, implying upside from the then-prevailing levels. The stock’s beta stays low near 0.86, offering relative stability. Book value per share stood near Rs 668, giving a price-to-book ratio of about 1.55.
Investors who want exposure to energy plus other growth areas often start with Reliance. Pure energy focused investors may prefer upstream names for higher leverage to crude prices. The company’s refining margin and petrochemical spreads also respond to global product cracks, adding another earnings driver beyond crude itself.
ONGC and Oil India benefit directly when crude realisations rise. ONGC’s consolidated sales for the trailing twelve months exceeded Rs 7 lakh crore in some reports, with net profit near Rs 44,793 crore (Source: Tapetide and company data). Debt to equity remains manageable at 0.47. Book value per share is around Rs 296, so the stock trades below book at a P/B of 0.79.
Oil India shows a PE of 9.0 and ROE of 12.7 percent. Its smaller size allows faster growth in select blocks. Both companies pay regular dividends supported by government ownership. ONGC declared an interim dividend of Rs 6 per share on a face value of Rs 5 in one of its recent quarters, translating to a high payout ratio.
Jefferies and JM Financial have preferred upstream names over OMCs in recent notes when Brent stayed elevated (Source: Zee Business and ET Energyworld, October 2026). Upstream earnings rise almost linearly with crude price increases, while OMCs face policy constraints on retail pricing. Every $1 rise in crude can add roughly 1-2 percent to EPS for these producers according to brokerage estimates.
Indian Oil Corporation runs the largest refining capacity among public sector units. Its PE of 3.9 is the lowest in the table. ROE of 19.2 percent looks strong, yet under-recoveries on LPG can swing quarterly profits. BPCL combines refining and marketing with a PE of 8.0 and dividend yield of 6.8 percent. BPCL’s market capitalisation stood at Rs 1.23 lakh crore on 2 November 2026.
HPCL carries higher debt to equity of 1.40 and a PE of 51.5 after recent profit compression. Brokerages have rated it underperform in high-crude scenarios. Investors who hold these stocks should track monthly retail price decisions and inventory gains or losses. LPG under-recoveries for the sector reached Rs 67,889 crore in recent estimates, with HPCL facing a larger share because of its marketing mix.
A real portfolio example: an investor allocating 10 percent of equity to energy might split it between Reliance for scale and ONGC for pure upstream exposure rather than loading only on OMCs. This mix captures both volume growth and commodity upside while limiting policy risk.
GAIL (India) transports natural gas through pipelines and markets it. Its PE of 8.8 and debt to equity of 0.19 stand out for balance-sheet strength. Dividend yield sits near 4.5 percent. City gas distributors such as Indraprastha Gas and Adani Total Gas serve urban demand growth. Adani Total Gas traded at a PE above 90 in some snapshots, reflecting growth expectations in its network expansion.
Petronet LNG imports liquefied natural gas and re-gasifies it. Its PE near 10.7 and ROE of 18.6 percent appear in index data. These companies benefit from rising domestic gas consumption even when crude prices fluctuate. India’s city gas distribution network continues to expand under government programmes, supporting volume growth for GAIL and the city gas companies.
Brent crude near $110 in early November 2026 created a clear split. Upstream producers recorded better realisations. OMCs reported inventory gains in some quarters but also higher under-recoveries on subsidised products. Historical data from 2022 shows the same pattern: when crude spiked above $120, ONGC and Oil India outperformed while pure marketing names lagged.
Government excise duty changes can alter the picture overnight. A cut in excise can support retail volumes but may not fully offset higher crude for OMCs. Investors should therefore monitor both the global crude chart and domestic policy announcements before increasing position sizes.
Use a stock screener to filter the sector by PE below 15, ROE above 12 percent and debt to equity below 1. This removes high-valuation or leveraged names. The stock screener on Dhanarthi covers 5,000+ NSE and BSE stocks with more than 150 filters. Select the Oil, Gas & Consumable Fuels sector and apply the conditions above.
For deeper work, open the full financial analysis reports to check cash flow, inventory movements and segment margins. Compare the same metrics across ONGC, BPCL and Reliance rather than relying on a single PE number. Looking at quarterly sales growth and profit variance helps separate temporary inventory effects from structural trends.
Crude price volatility remains the largest risk. A drop from $110 to $70 reduces upstream profits sharply. Government decisions on excise duty or retail price freezes affect OMC margins. Currency movements matter because crude is priced in dollars. A weaker rupee raises the landed cost of imports for refiners.
Historical example: during the 2022 crude spike above $120, OMC stocks lagged while upstream names outperformed. Investors who held only refiners saw temporary losses even though long-term demand stayed intact. Diversifying across the value chain and keeping position sizes moderate reduces this cycle risk. Another risk is execution delay on new exploration blocks or refinery expansions, which can keep returns below expectations for years.
SEBI and exchange disclosures require companies to report inventory gains and under-recoveries. Checking the latest quarterly filing on BSE or NSE gives the most accurate picture before buying. The Nifty Oil & Gas index itself traded at a PE of 10.31 and dividend yield of 3.41 percent as of late October 2026, offering a sector-level benchmark.

Confused about chart patterns & stock analysis?
Use
Dhanarthi Stock Guru
to chat, analyze price patterns, and ask questions directly.
The best oil gas stocks India offers in 2026 span upstream producers trading at low PE ratios and large integrated players such as Reliance. ONGC and Oil India provide direct crude exposure with decent dividend yields. Indian Oil and BPCL offer higher ROE but carry policy risk. Data as of 2 November 2026 shows clear differences in valuation and profitability that investors can verify on exchange sites.
Run the numbers on a screener, read the latest filings, and size positions according to your risk tolerance. Markets change, so re-check the metrics before any decision.
This article is for educational purposes only. It does not constitute investment advice. Please consult a SEBI-registered financial advisor before making investment decisions.
1. What are the best oil and gas stocks in India right now?
Reliance Industries leads by market capitalisation above Rs 17 lakh crore. ONGC, Indian Oil, BPCL and Oil India follow with lower PE ratios between 3.9 and 9.0 as of November 2026.
2. Why do some oil stocks have high PE ratios?
HPCL shows a PE above 50 because recent profits were compressed by under-recoveries and high crude costs. Valuation expands when earnings fall even if the business remains operational.
3. Do oil and gas stocks pay good dividends?
Yes. ONGC yields about 5.6 percent, BPCL near 6.8 percent and Indian Oil around 6.1 percent based on November 2026 prices and declared dividends.
4. How does crude oil price affect these stocks?
Upstream companies such as ONGC earn more when crude rises. Oil marketing companies face margin pressure if retail prices do not rise in line with input costs.
5. Where can I find the latest financial numbers for these companies?
Check NSE and BSE filings, company annual reports, and the Dhanarthi stock screener for updated PE, ROE and market cap figures.
Share Market
IPO
Artificial Intelligence
Semi Conductor