



Best AI Stock Analysis Tools India 2026
October 31, 2026


TABLE OF CONTENTS
Get AI Summary



The best AI stock analysis tools India investors use in 2026 combine live NSE and BSE data with plain-English queries so beginners can screen 5,000+ stocks, summarise annual reports and compare ratios without manual spreadsheet work.
Retail investors in India face thousands of listed companies and lengthy filings. Tools that connect directly to exchange data reduce the time spent copying numbers and lower the chance of outdated figures. Platforms built for Indian markets pull PE ratios, ROE, debt levels and quarterly results from BSE and NSE filings. General chat tools can explain concepts but often lack current Indian company data unless the user pastes filings. This guide compares the main options available to Indian retail investors in late 2026.
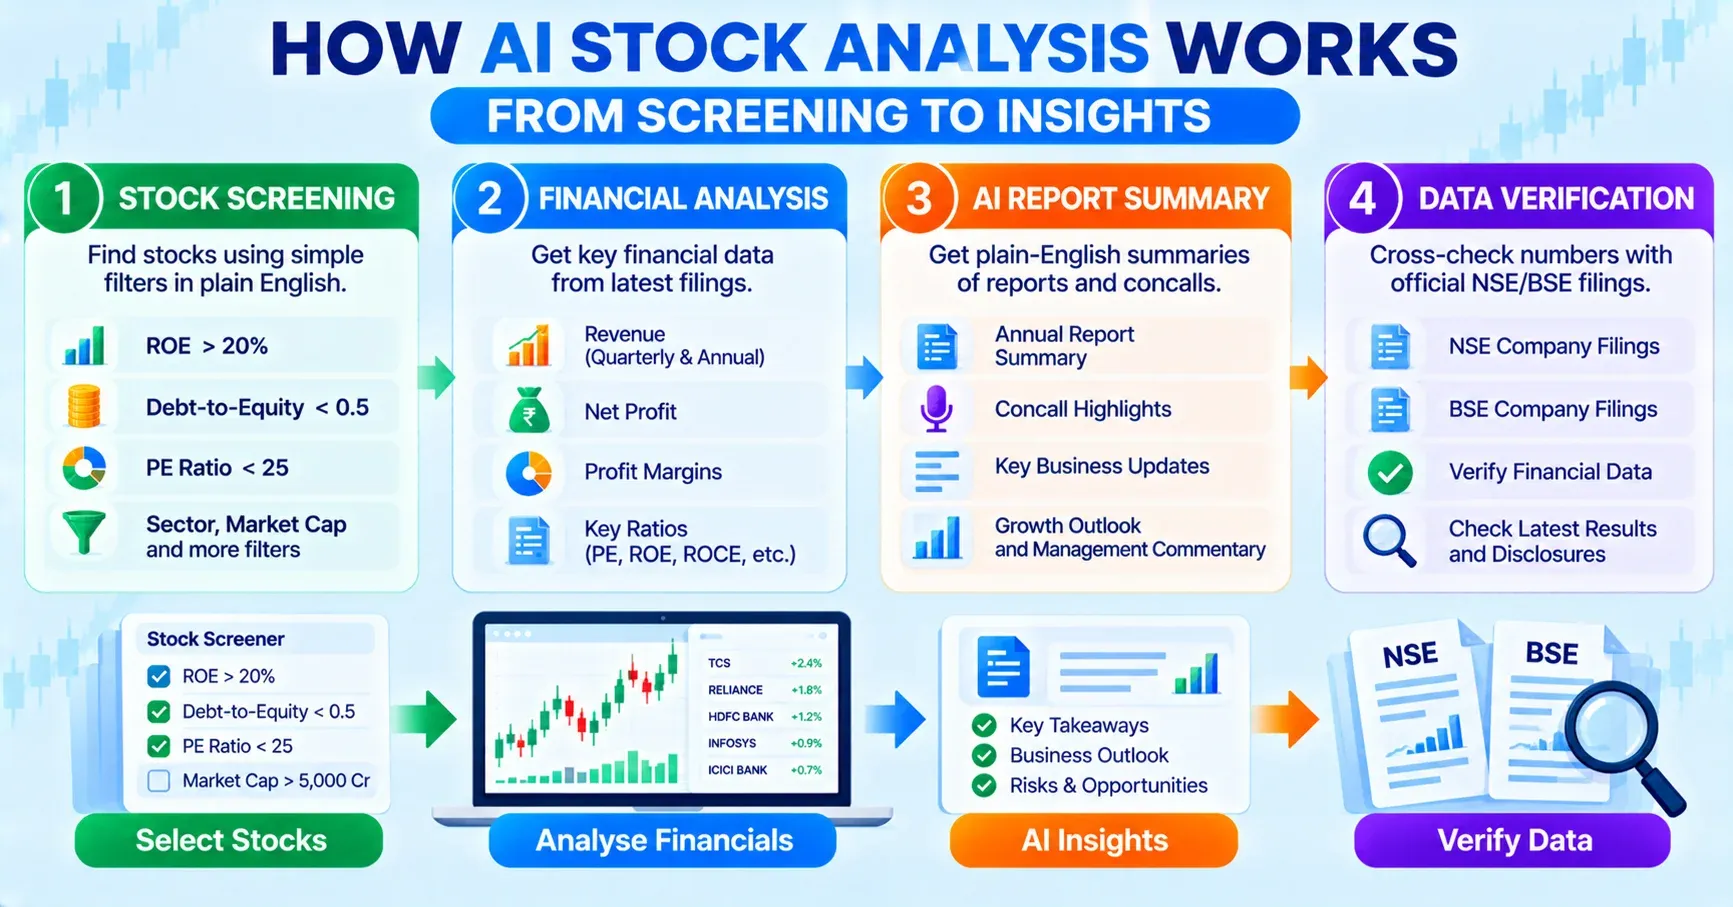
AI stock analysis tools read financial statements, run screens and return structured answers from verified sources. They do not replace judgment. They speed up the first pass of research.
A typical workflow starts with a screen. An investor types "Nifty 50 stocks with ROE above 20 percent and debt to equity below 0.5". The tool returns a shortlist with current ratios. Next, the investor asks for a summary of the latest quarterly results or a comparison of two peers. The output lists revenue, profit, margins and key management comments from the company filing.
Infosys reported consolidated revenue of Rs 49,244 crore and net profit of Rs 7,823 crore for the quarter ended 30 September 2026 (Source: Infosys Q2 FY27 results, company filing and The Hindu, 23 October 2026). An AI tool connected to exchange data can surface these figures and the year-on-year growth rates (revenue +10.7 percent, profit +6.2 percent) without the user downloading the PDF. The same tool can note that the company lowered full-year revenue growth guidance to 1-2 percent in constant currency.
Common investor mistake: treating an AI summary as the final investment decision. The numbers still need cross-check against the primary BSE or NSE filing, and the business model still needs human review.
The table below compares five platforms widely used by Indian retail investors as of October 2026. Coverage numbers and features come from each platform’s public pages.
| Platform | Indian Stock Coverage | Free AI Queries | Live NSE/BSE Data | Best Use Case |
|---|---|---|---|---|
| Dhanarthi Stock Guru | 5,000+ NSE + BSE | 10 per day | Yes | Plain-English screens and report summaries |
| Trendlyne | ~4,500 | Limited free | Yes | DVM scores and plain-English screener mode |
| Tickertape | ~4,000–4,600 | Basic free | Yes | Scorecards and visual filters |
| Screener.in | ~5,000 | Pay-per-answer AI | Yes | Custom fundamental queries with long history |
| Trade Brains Portal AI | Broad Indian | Free tier | Yes | Pre-set prompts on company financials |
Data sourced from platform feature pages and NSE/BSE listings. Last updated: October 2026.
Dhanarthi stands out for free daily plain-English access to 5,000+ stocks plus chart upload analysis. Trendlyne adds a proprietary DVM (Durability, Valuation, Momentum) score that many intermediate investors use as a quick quality filter. Tickertape offers clean scorecards that beginners find easy to read. Screener.in remains strong for users who write their own ratio formulas and want 10-year history. Trade Brains provides ready prompts that help new users start without knowing exact filter syntax.
Stock Guru on Dhanarthi.com is an AI research assistant built only for NSE and BSE listed companies. Users type questions in plain English. The system runs the screen or pulls the ratios and returns structured numbers with source context.
Example query: "Show Nifty 50 stocks with ROE above 20 percent and debt to equity below 0.5". The tool returns the matching names with current ratios. Another query can ask for a summary of the latest concall or annual report commentary. Chart upload is also supported: the user uploads a price chart image and receives key levels and trend direction.
Free plan allows up to 10 questions per day. Premium raises the limit and adds deeper scans. Data comes from exchange sources and company filings. For deeper structured reports on any shortlisted name, the deep stock research tool generates multi-level fundamental summaries from live data.
Users who prefer conversational research can open the AI Financial Research Assistant and type the same filters in plain English.
Trendlyne’s AI Screener Mode converts plain English into working screener queries. A user can type "debt-free companies with high ROE" and receive a ready filter set. The platform also offers DVM scores and AI-generated summaries of quarterly earnings calls. Free tier covers basic scorecards and watchlists. Paid plans unlock advanced parameters and more AI credits.
Tickertape provides an Investment Checklist that scores companies on profitability, valuation and growth. It covers roughly 4,600 Indian stocks with more than 200 filters. The free version handles basic screening. Pro unlocks additional custom filters and data export. Many beginners start here because the visual scorecards reduce the need to interpret raw ratios immediately.
Both platforms pull from NSE and BSE data. Neither replaces reading the full annual report, but both shorten the time to reach a shortlist of 20–30 names worth deeper study.
Infosys Q2 FY27 results give a clear test case. Revenue reached Rs 49,244 crore (+10.7 percent year-on-year). Net profit stood at Rs 7,823 crore (+6.2 percent year-on-year). Operating margin held at 21.0 percent. Large deal wins totalled $5.2 billion, with AI-related revenue accounting for 10.5 percent of total revenue (Source: Infosys Q2 FY27 results announcement, 23 October 2026).
An AI tool connected to live data can list these figures, calculate the sequential growth (profit +0.7 percent from the June quarter) and flag the guidance cut. A user can then ask for a peer comparison with Tata Consultancy Services. The output shows relative PE, ROE and recent deal momentum without manual copying.
Historical market event: during the 2022–2023 rate-hike period, many investors who relied only on low-PE screens missed that high-quality IT names maintained strong cash flows even as multiples compressed. Checking ROE and free cash flow alongside PE reduced that error.
One frequent error is accepting every number without opening the source filing. Even tools that cite data can occasionally lag by a day after a results announcement. Cross-check the primary BSE or NSE announcement page.
Another mistake is using a general chatbot for mid-cap and small-cap Indian stocks without pasting the latest filing. Coverage and accuracy drop outside large-cap names. Purpose-built Indian tools that maintain their own data feeds perform better here.
A third error is treating an AI score or summary as a buy signal. The score reflects past and current numbers. Future business outcomes still depend on competition, regulation and management execution. SEBI requires that any investment advice come from registered advisors. Tools on educational platforms remain research aids only.
Beginners who want free plain-English access often start with Dhanarthi Stock Guru plus the built-in screener. The combination covers screening, basic ratio explanation and report summaries within daily free limits.
Intermediate investors who already know ratios and want proprietary scores add Trendlyne or Tickertape. They use the AI layer for faster query building and call summaries while keeping their own valuation models.
Users focused on long historical fundamental series stay with Screener.in and add an AI layer only for summarisation. Active chart users keep TradingView for technical work and use an Indian fundamental tool for the business side.
No single tool covers every need. Most serious retail investors run two or three in parallel: one for screens, one for deep filings and one for charts.
Every tool has clear boundaries. None of them can predict next quarter’s revenue with certainty. Models trained on past data miss sudden regulatory changes, management exits or global demand shocks. In the Indian context, SEBI circulars on related-party transactions or promoter pledging can change a company’s risk profile overnight. An AI summary generated the previous day will not include the latest announcement until the data feed refreshes.
Data lag is another limit. After results are declared after market hours, some platforms update ratios the next morning. Investors who trade the open on incomplete numbers face higher risk. Always verify the timestamp on the source filing.
General-purpose AI tools introduce an additional risk. Studies of large language models have shown error rates between 20 and 57 percent on numerical financial questions when no primary source is supplied. Purpose-built Indian platforms that store the filings themselves reduce this risk but do not eliminate it. The user remains responsible for the final check.
Start with a broad screen on a dedicated Indian platform. Apply three to five filters only: ROE above 15 percent, debt to equity below 1, positive three-year profit growth, and market capitalisation above Rs 5,000 crore. This keeps the list manageable.
Next, upload or request a summary of the latest quarterly results for the top five names. Note revenue growth, margin change and any guidance revision. Open the actual BSE or NSE announcement and confirm the headline numbers match.
Then ask for a peer comparison. For an IT name such as Infosys, compare with Tata Consultancy Services on ROE, free cash flow and recent deal wins. Look for differences in capital intensity and client concentration.
Finally, read the management commentary section yourself. AI can extract sentences, but tone, hedging language and new risk disclosures are easier to judge when you read the original paragraph. This step usually takes less than 15 minutes once the shortlist is ready.
Reliance Industries presents a different profile from pure IT companies. As of late October 2026 its market capitalisation stood above Rs 15 lakh crore on most data platforms. PE ratios around 19–23 and ROE near 10–11 percent reflect the capital-intensive energy, retail and telecom businesses. An AI tool that only ranks on high ROE will often exclude it even though the company remains a core holding for many large portfolios.
The tool can still surface the latest quarterly EBITDA figures and segment breakdowns once the results filing is processed. Investors then decide whether the lower ROE is acceptable given the scale and cash generation. This is exactly the judgment step that no automated score can complete alone.
During the 2020–2021 liquidity-driven rally many AI screens highlighted high-growth small-caps. When interest rates rose in 2022 those same screens did not automatically flag the higher sensitivity of leveraged balance sheets. Investors who added a debt filter and checked free cash flow conversion avoided larger drawdowns. The lesson remains relevant in 2026: combine AI speed with basic quality filters that have worked across cycles.
A practical allocation example for a beginner portfolio of Rs 5 lakh might start with 60 percent in large-cap names that pass high-ROE low-debt screens, 20 percent in mid-caps after deeper filing review, and 20 percent in cash or debt funds until the research process is comfortable. The percentages are illustrative only and must match personal risk capacity.
Following this list keeps the speed advantage of AI while preserving the verification habit that protects capital.
The best AI stock analysis tools India retail investors can use in 2026 are those that connect to live NSE and BSE data and answer questions in plain English. Dhanarthi Stock Guru, Trendlyne, Tickertape and Screener.in each solve different parts of the research workflow. Real company numbers such as Infosys’s Q2 FY27 revenue of Rs 49,244 crore and profit of Rs 7,823 crore become available faster, yet every figure still needs verification against the original filing. Tools reduce time. Judgment remains with the investor.
This article is for educational purposes only. It does not constitute investment advice. Please consult a SEBI-registered financial advisor before making investment decisions.
1. What is the best free AI stock analysis tool for Indian stocks in 2026?
Dhanarthi Stock Guru offers free plain-English queries on 5,000+ NSE and BSE stocks with live data. Trendlyne and Tickertape also provide free tiers with scores and basic screens. Free limits vary by platform.
2. Can ChatGPT replace dedicated Indian stock analysis tools?
General chat tools explain concepts well but lack built-in live NSE and BSE ratios for most stocks. Purpose-built tools pull current numbers directly from exchange sources and reduce the need to paste filings.
3. How accurate are AI summaries of quarterly results?
Accuracy is higher on platforms that cite company filings and refresh from BSE/NSE. Always open the original results announcement to confirm revenue, profit and guidance figures before acting.
4. Do these tools give buy or sell recommendations?
Educational platforms do not provide investment advice. They return data, screens and summaries. Any recommendation must come from a SEBI-registered advisor after a full suitability check.
5. Which tool works best for screening high-ROE low-debt stocks?
Dhanarthi Stock Guru and Trendlyne both accept plain-English queries such as ROE above 20 percent and debt to equity below 0.5. The screener returns matching Nifty or broader universe names with current ratios.
Share Market
IPO
Artificial Intelligence
Semi Conductor