




Best Stock Screener India 2026: Top Tools for Finding Quality Stocks
October 29, 2026


TABLE OF CONTENTS
Get AI Summary



The best stock screener India investors use in 2026 filters over 5,000 NSE and BSE listed companies by PE ratio, ROE, debt levels and sector in seconds. Platforms like Dhanarthi, Screener.in and Tickertape help beginners and intermediates shortlist quality stocks using real data from exchange filings instead of tips.
Indian retail investors face more than 5,000 listed companies across NSE and BSE. Manual checking of balance sheets takes hours. A stock screener cuts this to minutes by applying filters on profitability, valuation and growth. This guide compares the top tools available in October 2026 and shows how to use them with real company numbers.
A useful stock screener covers both NSE and BSE stocks, updates data from company filings, and offers both fundamental and technical filters. Coverage of 4,000 to 5,000 stocks matters because many quality mid-cap names sit outside the Nifty 50. Data freshness from NSE and BSE filings prevents decisions based on outdated numbers.
Beginners need simple ready-made screens. Intermediate users need custom filters on ROE above 15 percent, debt-to-equity below 1 and PE below sector average. Advanced users want multi-year historical screening and AI explanations of results. The Dhanarthi stock screener covers 5,000+ stocks with 150+ filters and AI ranking at no cost for basic use.
Common investor mistake: applying only low PE filters without checking ROE or cash flow. This produces value traps where cheap stocks keep getting cheaper because business quality is poor.
The table below compares five widely used platforms based on stock coverage, free filters, quality scoring and custom query support as of October 2026. Data comes from each platform’s public pages.
| Platform | Stock Universe | Free Filters | Quality Score | Custom Queries | Best For |
|---|---|---|---|---|---|
| Dhanarthi | 5,000+ NSE+BSE | 150+ | Yes (AI grading) | Yes + AI | Beginners to intermediates wanting AI help |
| Screener.in | ~5,000 | ~50 | No | Yes (formula) | Users who write custom fundamental queries |
| Tickertape | ~4,000 | ~150 | Yes (Scorecard) | Limited | Visual learners and beginners |
| Trendlyne | ~4,500 | 100+ | Yes (DVM style) | Pro tier | Research-driven investors |
| Chartink | Technical focus | High technical | No | Yes (patterns) | Short-term technical traders |
Data sourced from platform feature pages and NSE/BSE listings. Last updated: October 2026.
Screener.in remains strong for pure fundamental investors who want 10-year financial history and custom ratios. Dhanarthi stands out because it adds AI that reads financial reports in plain English and grades stocks as Good, Average or Poor. Tickertape works well when you prefer scorecards over raw numbers.
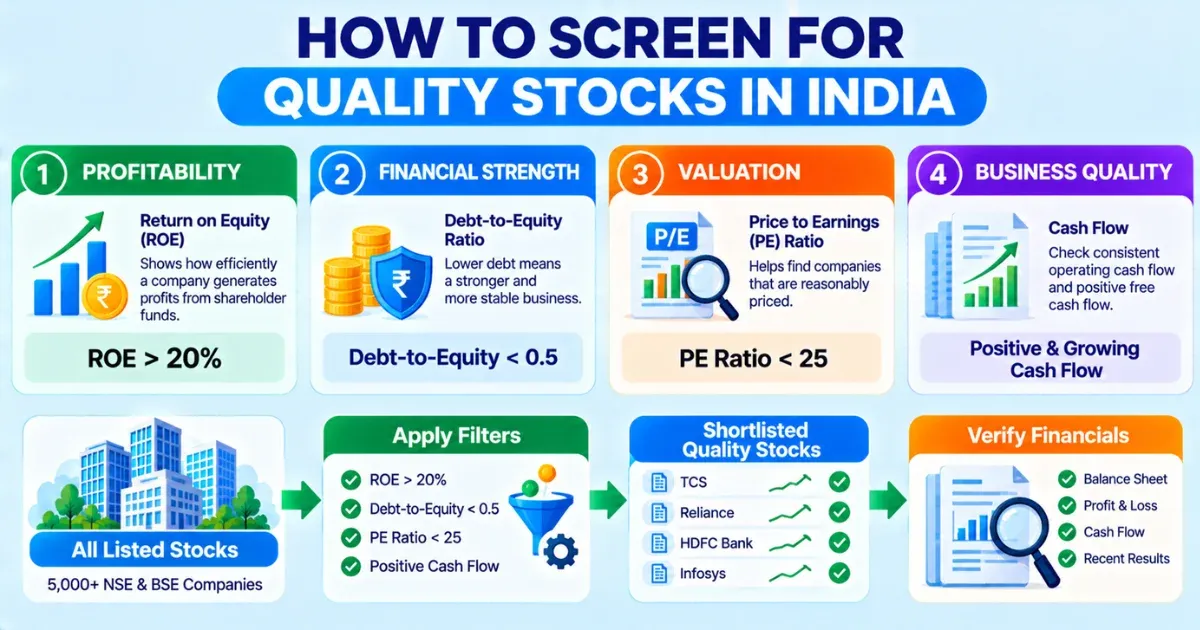
Run a basic quality screen: ROE above 20 percent, debt-to-equity below 0.5 and PE below 25. This filter removes highly leveraged companies and those with weak returns on capital.
Tata Consultancy Services met similar criteria in late October 2026. Its ROE stood at 45.59 percent, PE ratio at 17.40 and market capitalisation at Rs 8,90,050 crore (Source: Dhan and ET Markets data as of 28 October 2026). The company reported consistent profitability from IT services revenue.
Reliance Industries shows a different profile. Market capitalisation reached Rs 15,67,068 crore with PE around 19.40 and ROE near 10.94 percent as of 28 October 2026 (Source: ET Money and Value Research data). Its lower ROE reflects the capital-intensive energy and retail businesses, so pure ROE screens may exclude it even when the business remains strong on other metrics.
Use the financial analysis tools after screening to read the balance sheet, profit and loss and cash flow of shortlisted names. Screening gives the shortlist. Reading the actual filings confirms the numbers.
Most platforms offer free basic screening. Paid tiers unlock more historical data, alerts, backtesting or higher query limits. Screener.in premium costs around Rs 4,999 per year for deeper exports and community screens. Tickertape and Trendlyne have similar annual plans between Rs 2,000 and Rs 8,000.
Dhanarthi keeps core screening free with 150+ filters and 50+ ready-made screens. Pro plans add unlimited AI report analysis and deeper ratio weightage. For most retail investors starting out, free tiers cover daily research needs. Paid features help when you screen hundreds of stocks weekly or need automated alerts.
NSE itself launched Market Lens as a free beta screener in 2026 covering NSE listed stocks with basic filters. It works for simple checks but lacks the AI explanations and multi-year custom queries found on dedicated platforms.
Investors often set filters too tight and get zero results. Start with three conditions maximum, then add more. Another error is ignoring sector context. A PE of 30 looks high for a bank but normal for a high-growth IT or consumer company.
Data lag creates problems. Some free tools update quarterly while company results come every three months. Cross-check key numbers against the latest NSE or BSE filing. Promoter pledging and related-party transactions do not appear in basic PE or ROE screens. Check the shareholding pattern separately.
Historical market event: During the 2020 COVID correction, many low-PE stocks recovered only if they also showed positive free cash flow and low debt. Screens that ignored cash flow produced weak shortlists.
Open the stock screener page. Select an index such as Nifty 500 or all stocks. Choose a sector if you want focus, for example IT or Banking. Add conditions: PE ratio less than 20, ROE greater than 15 percent, debt-to-equity less than 1. Run the query.
Results appear instantly with key ratios. Click any stock to open its full page showing multi-year financials. Save the screen for reuse next month. The AI option lets you type “high ROE low debt stocks in pharma” and get filters set automatically.
This process takes under two minutes once you know the steps. Pair the shortlist with stock analysis on individual company pages for deeper reading of management commentary and segment results.
Different sectors need different filters. For banking stocks, focus on net interest margin, gross NPA and return on assets rather than simple PE. For IT services, track attrition rates, order book growth and constant currency revenue growth.
Pharma screens often use ROE above 15 percent and R&D spend as a percentage of sales. Energy and oil & gas companies need checks on crude price sensitivity and refining margins. The same PE filter does not work across all sectors.
Ready-made screens on major platforms already group these by sector. Start there, then customise. Export the list and track how the shortlist changes after quarterly results.
A screen produces candidates, not buy recommendations. Allocate only after checking three more items: latest quarterly results versus estimates, promoter holding trend and peer comparison. Many investors keep 20 to 30 percent of their equity portfolio in screened quality large-caps and the rest in mid-caps that pass similar filters.
Example portfolio allocation idea: 40 percent in stocks with ROE above 20 percent and PE below 20, 30 percent in dividend-paying names with yield above 2 percent, and 30 percent in growth stocks with sales growth above 15 percent. Re-run the screens every quarter after results season.
SEBI rules require that research and screening tools stay educational. No platform can guarantee returns. Always consult a SEBI-registered advisor for personal advice.
Once basic filters feel comfortable, intermediate investors add growth and quality layers. Combine ROE above 18 percent with five-year sales growth above 12 percent and free cash flow positive in the latest year. This combination reduces the chance of including companies that grew sales only by taking on heavy debt.
Another useful screen looks for improving margins. Filter for operating margin higher than the three-year average and debt-to-equity lower than three years ago. Such screens surface companies that are becoming more efficient while reducing leverage. Platforms that support multi-year data make these queries straightforward.
For cyclical sectors such as metals or auto, add a check that current PE sits below the five-year median PE. This helps avoid buying at peak cycle valuations. The same approach works for commodity-linked businesses where earnings swing with global prices.
Export the results and build a simple tracking sheet. Note the date of the screen, the number of stocks returned, and the average ROE of the list. After the next quarterly results, re-run the identical screen and measure how many names remain. Consistent survivors often deserve closer reading of their annual reports.
AI features on platforms like Dhanarthi read concall transcripts and annual report commentary and turn them into short summaries. This saves time when a screen returns 40 names and you need to understand why each company passed the filters. The AI does not replace reading the filings, but it highlights the key points so you know where to focus.
Some tools also grade stocks on a simple Good, Average or Poor scale based on a combination of valuation, profitability and growth. Use the grade as a starting point, then verify the underlying ratios yourself. AI scores change when new results arrive, so re-check after every earnings season.
Investors who combine traditional filters with AI summaries often finish research faster without skipping important details. The combination works especially well for retail investors who have limited hours each week for stock analysis.
Data from NSE shows more than 2,800 actively traded companies on the exchange as of mid-2026, while BSE lists over 5,900. Any useful screener must handle this full range so that mid-cap and small-cap opportunities are not missed. Regular updates from company filings keep the numbers current after each quarterly results season. Always confirm the latest figures on the official NSE and BSE websites before acting on a screen.
The best stock screener India for most retail investors in 2026 combines wide coverage of 5,000+ NSE and BSE stocks, free fundamental filters, and AI help to explain results. Dhanarthi, Screener.in and Tickertape each solve different parts of the research workflow. Start with ready-made screens, add your own conditions, and verify every shortlisted company against its latest exchange filings.
This article is for educational purposes only. It does not constitute investment advice. Please consult a SEBI-registered financial advisor before making investment decisions.
1. Which is the best stock screener in India for beginners in 2026?
Beginners do best with platforms that offer ready-made screens and clear quality scores. Dhanarthi and Tickertape both provide this. Start with filters on ROE above 15 percent and debt-to-equity below 1 before building custom queries.
2. Is Screener.in still useful compared with newer AI tools?
Yes. Screener.in remains the strongest free option for writing custom fundamental queries and viewing 10-year financial history. AI tools add plain-English explanations on top of the same data.
3. How many stocks can I screen at once?
Most platforms cover 4,000 to 5,000 listed companies. You can screen the full universe or restrict to an index like Nifty 500 or a single sector in one query.
4. Do free stock screeners show accurate data?
Free tiers pull data from NSE and BSE filings. Accuracy matches the exchange source, but always cross-check key ratios against the company’s latest quarterly results filing.
5. Can I use a stock screener for technical trading as well?
Yes. Chartink and TradingView focus on technical patterns and indicators. Fundamental screeners like Dhanarthi and Screener.in work better for longer-term quality stock selection.
Share Market
IPO
Artificial Intelligence
Semi Conductor