





MACD Explained: How to Use the MACD Indicator in Trading
October 27, 2026


TABLE OF CONTENTS
Get AI Summary



MACD (Moving Average Convergence Divergence) is a popular technical indicator that shows the relationship between two moving averages of a stock’s price. It helps traders identify trend direction, momentum, and possible buy or sell signals. The MACD line, signal line, and histogram together give a clear picture of whether momentum is increasing or decreasing. Most Indian traders use the default macd settings of 12, 26 and 9.
The macd indicator is widely used by both beginners and experienced traders in the Indian stock market. It works well on daily, weekly, and intraday charts. Many retail investors apply it on Nifty, Bank Nifty, and individual stocks to improve the timing of their entries and exits.
You can also explore related technical concepts like the RSI indicator and overall technical analysis principles.
MACD stands for Moving Average Convergence Divergence. It was developed by Gerald Appel in the late 1970s. The indicator is calculated using two exponential moving averages (EMAs) of the closing price.
Default macd settings used by most Indian traders:
The MACD line is the difference between the 12-period EMA and the 26-period EMA. The signal line is a 9-period EMA of the MACD line. The macd histogram shows the difference between the MACD line and the signal line.
When the MACD line is above the signal line, momentum is considered bullish. When it is below, momentum is considered bearish.
Research Stocks Smarter with Dhanarthi AI Screener
Analyze 5,000+ NSE & BSE stocks with 150+ custom filters, real-time volume breakout scans, and transparent fundamental data.
Use Dhanarthi Screener
The formula is straightforward:
MACD Line = 12-period EMA − 26-period EMA
Signal Line = 9-period EMA of MACD Line
Histogram = MACD Line − Signal Line
Most charting platforms on NSE and BSE (TradingView, Zerodha Kite, Upstox, Groww, etc.) calculate this automatically. You only need to select the macd indicator and keep the default 12, 26, 9 settings unless you have a tested reason to change them. These are widely accepted as the best macd settings for most Indian stocks and indices.
This is the main line. It reacts faster to price changes because it uses the shorter 12-period EMA.
This is a smoother line. Crossovers between the MACD line and the signal line generate the most common trading signals. Traders often call this the macd signal line.
The macd histogram makes it easy to see the strength of the momentum. When the bars are getting taller above the zero line, bullish momentum is increasing. When bars are getting taller below the zero line, bearish momentum is increasing.
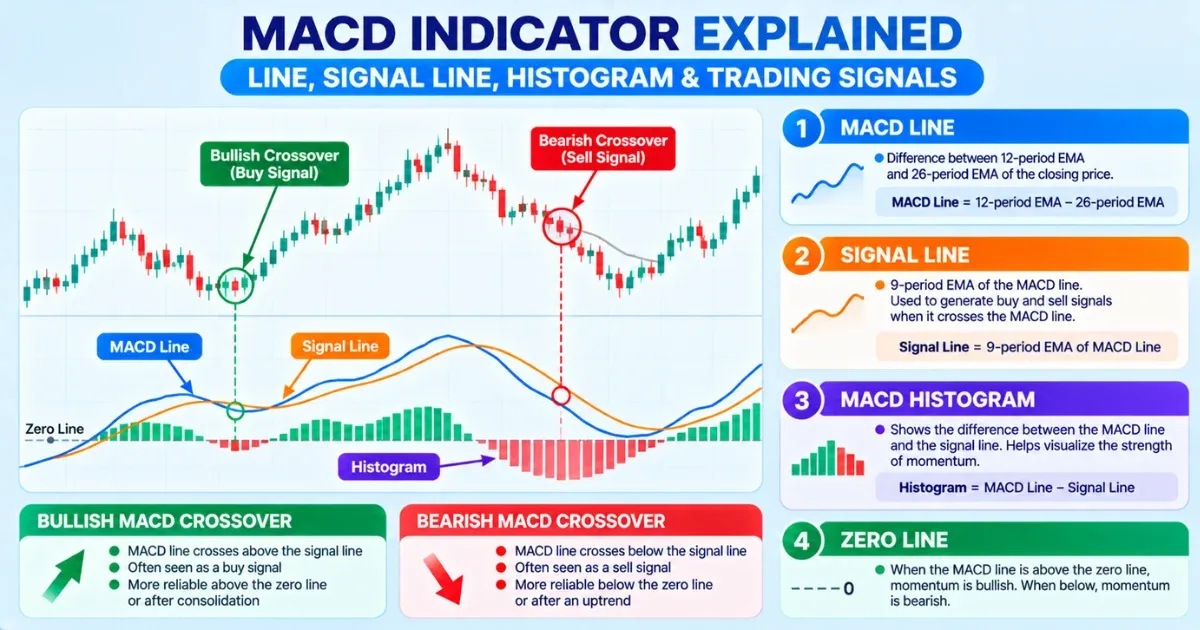
When the MACD line crosses above the signal line, many traders see it as a buy signal. This is known as a bullish macd crossover. It is more reliable when it happens above the zero line or after a period of consolidation.
When the MACD line crosses below the signal line, it is often treated as a sell or short signal. This is called a bearish macd crossover.
When the MACD line crosses above the zero line (macd zero line), it indicates that the short-term average has moved above the long-term average. This shows a bullish bias. The opposite is true for a cross below the zero line.
Bullish macd divergence occurs when the price makes a lower low but the MACD makes a higher low. This can signal a possible trend reversal. Bearish macd divergence is the opposite — price makes a higher high while MACD makes a lower high.
Many traders apply the macd indicator on stocks like Reliance Industries, TCS, HDFC Bank, and on Nifty 50 itself.
Practical tips for how to use macd in Indian markets:
MACD works better in trending markets. In range-bound markets it can give many false signals. Always confirm the overall trend before acting on a macd crossover.
| Feature | MACD | RSI |
|---|---|---|
| Type | Trend + Momentum | Momentum Oscillator |
| Range | No fixed range | 0 to 100 |
| Best for | Trend direction and crossovers | Overbought / Oversold levels |
| Default Settings | 12, 26, 9 | 14 periods |
| Divergence | Strong signal | Strong signal |
| Zero / Mid Line | Zero line | 50 level |
Both indicators are often used together. RSI helps identify overbought or oversold conditions while the macd indicator shows the direction and strength of momentum. You can read the full RSI indicator guide for a detailed comparison.

Confused about chart patterns & stock analysis?
Use
Dhanarthi Stock Guru
to chat, analyze price patterns, and ask questions directly.
The macd indicator is one of the most widely used tools in technical analysis for Indian stocks and indices. It helps traders understand momentum and possible trend changes through macd crossovers, zero-line moves, and macd divergence. Like any indicator, it works best when combined with other tools and proper risk management.
Practice reading the macd histogram and signal line on live charts of Nifty and a few liquid stocks. Over time you will develop a better feel for which signals are worth taking.
This article is for educational purposes only. It does not constitute investment advice. Please consult a SEBI-registered financial advisor before making investment decisions.
1. What does MACD stand for?
MACD stands for Moving Average Convergence Divergence. It measures the relationship between two exponential moving averages of price.
2. What are the best MACD settings?
The standard and most widely used macd settings are 12, 26 and 9. These work well on daily and hourly charts for Indian stocks.
3. Is MACD good for beginners?
Yes. The signals are visual and easy to understand. Beginners should still practice on charts and always use a stop-loss.
4. Can MACD be used for intraday trading?
Yes. Many traders use the macd indicator on 5-minute, 15-minute and 1-hour charts for intraday trades on Nifty and Bank Nifty.
5. What is MACD divergence?
MACD divergence occurs when price and the MACD line move in opposite directions. It can signal a possible trend reversal.
Share Market
IPO
Artificial Intelligence
Semi Conductor