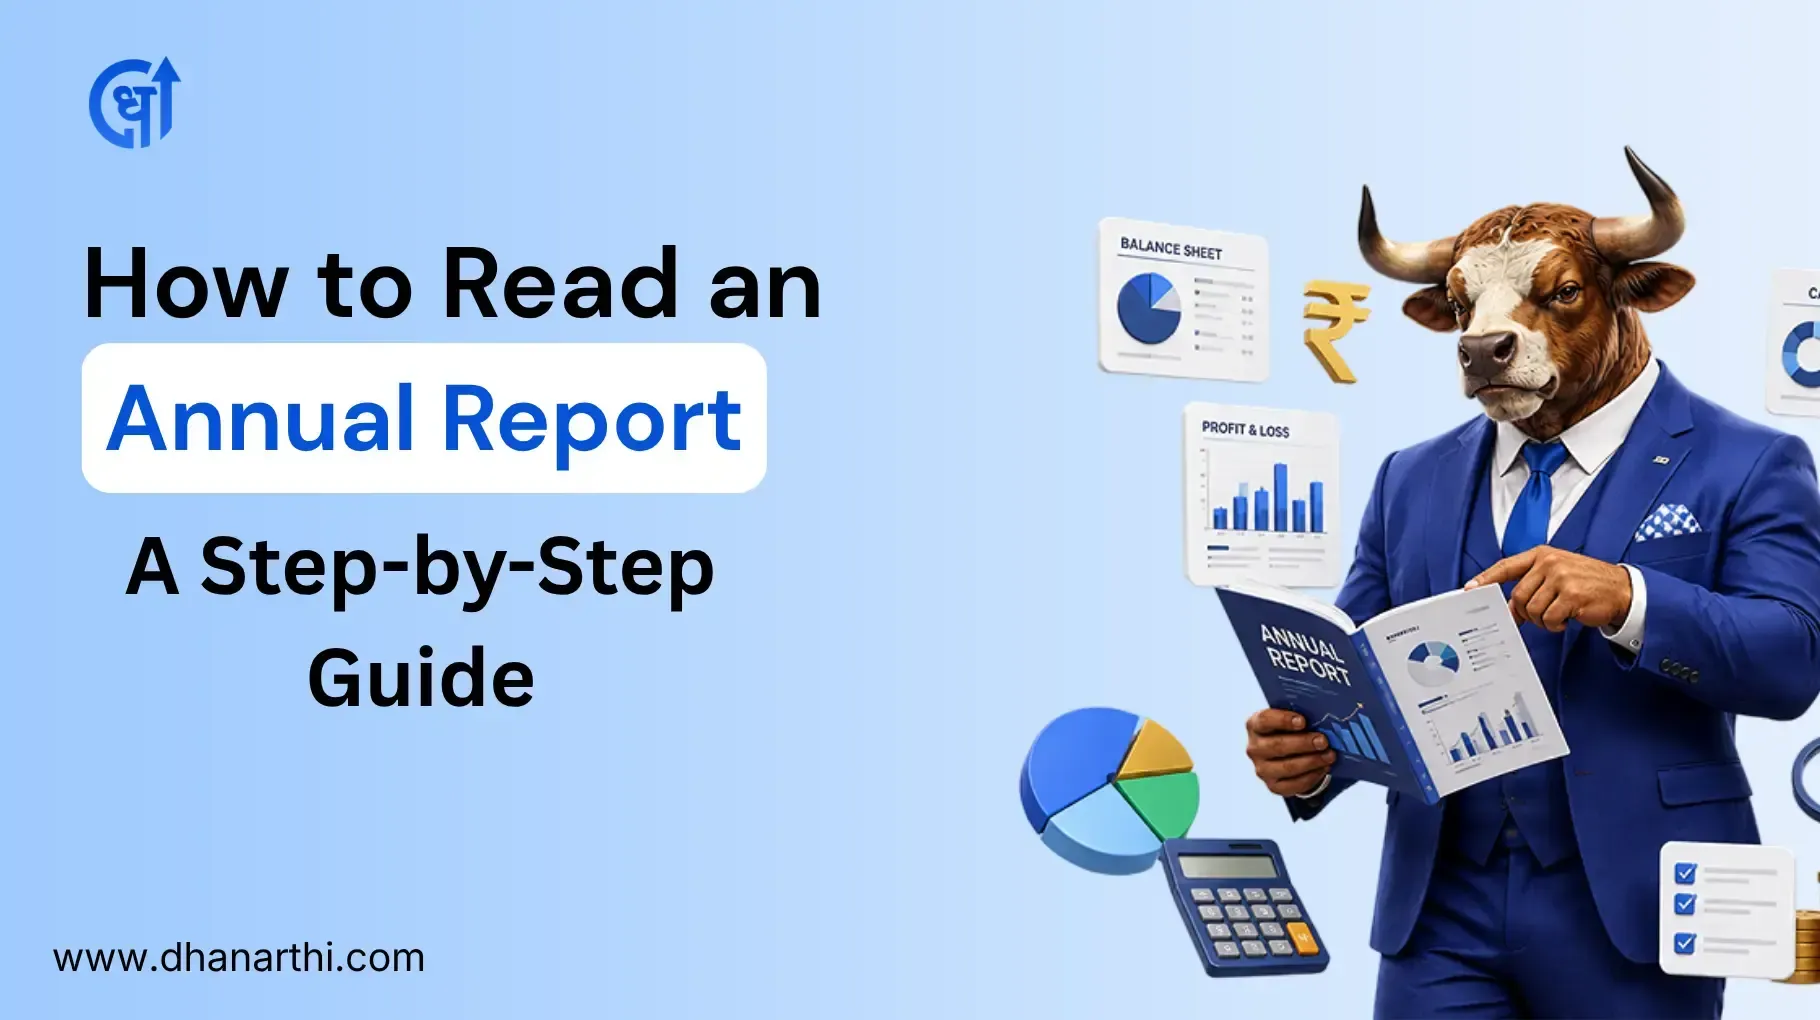


How to Read a Balance Sheet? Liabilities, Equity & more
June 9, 2026

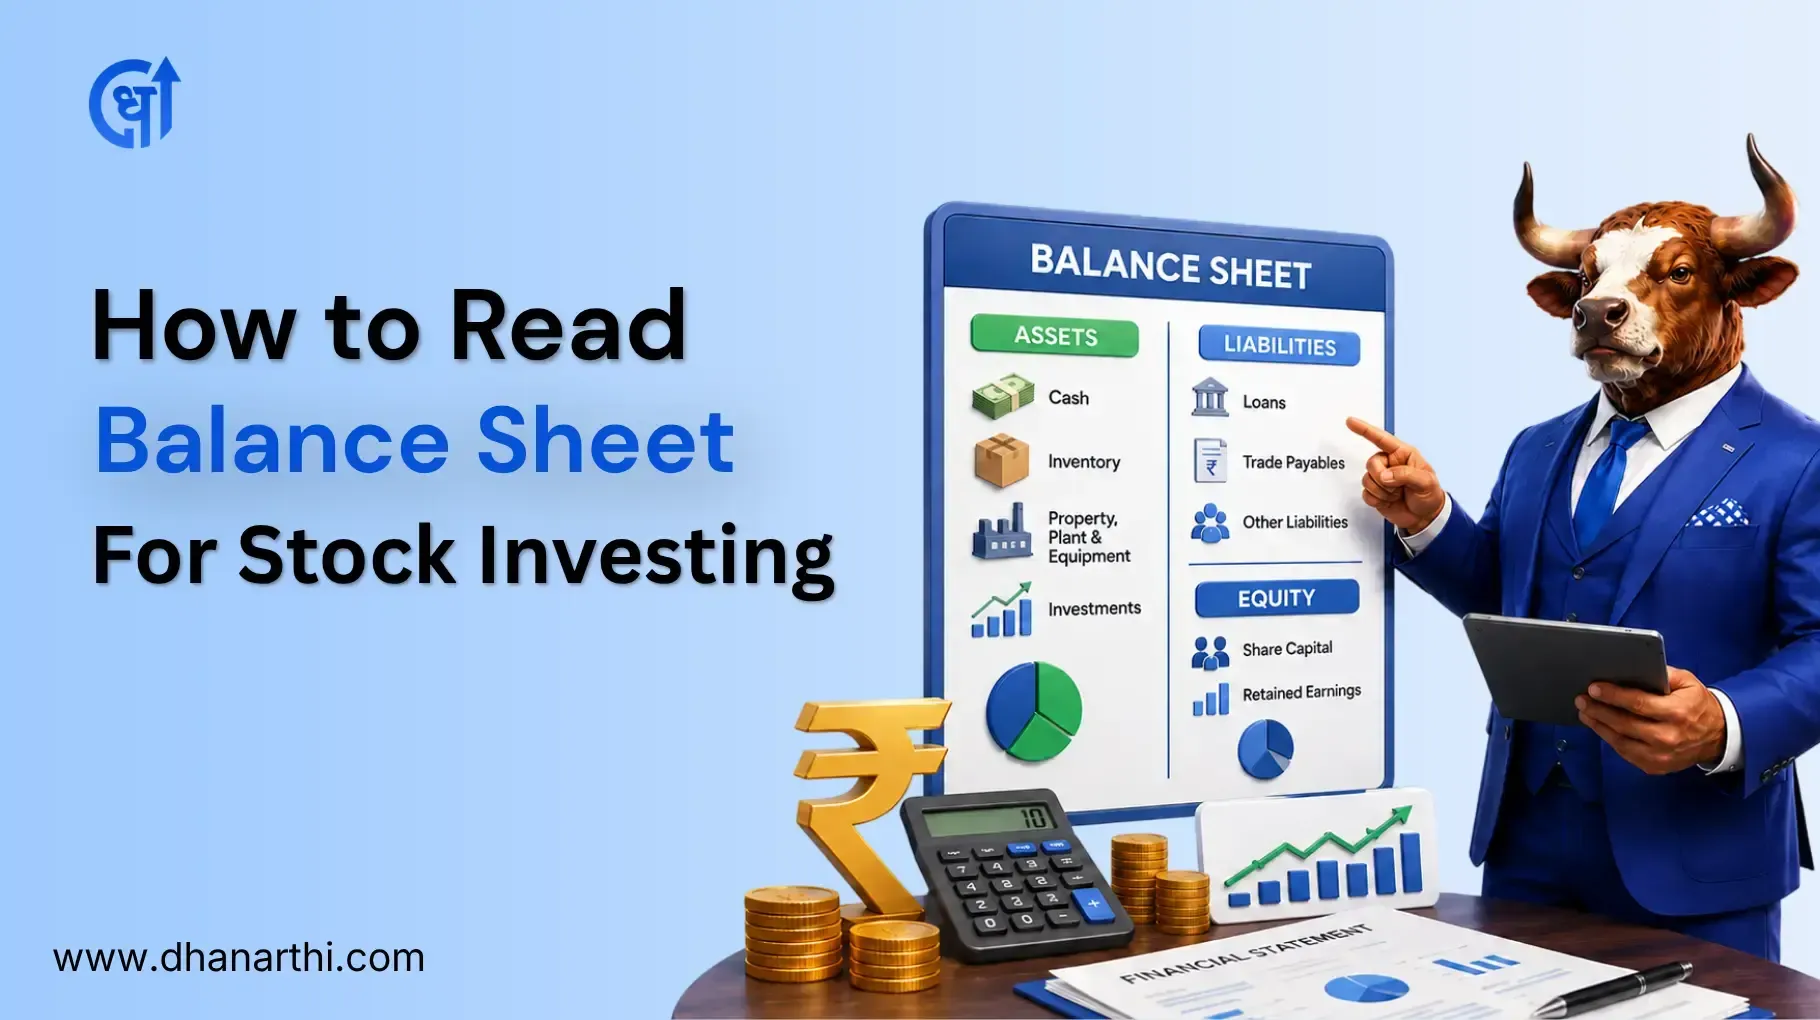
TABLE OF CONTENTS
Get an AI Summary of This Post Using The Tools Below.


A balance sheet is a financial statement that shows what a company owns (assets), what it owes (liabilities), and what belongs to shareholders (equity) on a specific date. To read it for investing, check the accounting equation: Assets = Liabilities + Shareholders' Equity. Then analyse liquidity, debt levels, and equity growth using key ratios.
Before investing in any stock, there must be three financial statements considered initially. The first one that needs to be analyzed before investing in a company’s stocks is the balance sheet.For a broader foundation, start with financial statement analysis before diving deeper into ratios.
The balance sheet presents the financial condition of the firm on a particular point in time, usually ending on March 31st for the Indian company in an April-March fiscal year.
It is one of the three essential financial statements; the other two being the Profit and Loss statement and the Cash flow statement. Under the SEBI Listing Obligation and Disclosure Requirement (LODR) regulation 2015, all firms listed under it are mandated to disclose their balance sheet every quarter, within a period of 45 days from the end of each quarter (Source: SEBI LODR Regulation 33, 2015).
The basic equation behind every balance sheet:
Assets = Liabilities + Shareholders' Equity
A practical example: A company raises Rs 30 crore from shareholders and borrows Rs 50 crore from a bank to build a factory worth Rs 80 crore. On the balance sheet, assets show Rs 80 crore, liabilities show Rs 50 crore, and equity shows Rs 30 crore. The equation balances.
This equation never breaks. If it does, there is an accounting error.
Assets are everything a company owns or controls that generates value.
Current assets convert to cash within one year: cash and bank balances, trade receivables, inventory, and short-term investments.
Non-current assets are long-term holdings: property, plant and equipment (PP&E), intangible assets, and long-term investments.
For a manufacturing company like Asian Paints, raw material inventory and trade receivables form a large share of current assets. For an IT company like Infosys, cash and short-term investments dominate.
Liabilities are amounts a company owes to external parties.
Current liabilities are due within one year: trade payables, short-term borrowings, and advance payments received.
Non-current liabilities are long-term obligations: term loans, deferred tax liabilities, lease obligations.
High non-current liabilities are normal for capital-intensive sectors (power, infrastructure, telecom) but warrant scrutiny in asset-light businesses.
Shareholders' equity is what remains after subtracting all liabilities from total assets.
Shareholders' Equity = Assets minus Liabilities
Share capital, reserve, and surplus constitute this component. Persistent growth in reserve and surplus for five consecutive years suggests a profitable entity where the firm retains its earnings instead of paying them off as dividends or incurring losses.
Four ratios tell most of the story about a company's financial health. Each is calculated directly from balance sheet figures.
| Ratio | Formula | What It Tells You | Healthy Benchmark |
|---|---|---|---|
| Current Ratio | Current Assets / Current Liabilities | Can the company pay short-term dues? | Above 1.5 |
| Quick Ratio | (Current Assets minus Inventory) / Current Liabilities | Liquidity without relying on selling inventory | Above 1.0 |
| Debt-to-Equity (D/E) | Total Debt / Shareholders' Equity | How much debt is used vs shareholder funds | Below 1.0 (varies by sector) |
| Return on Equity (ROE) | Net Profit / Shareholders' Equity x 100 | How efficiently equity generate profit | Above 15% |
Data sourced from NSE/BSE company filings. Benchmarks are general guidelines. Last updated: June 2026.
Real company comparison — FY25:
| Metric | Infosys (IT) | Tata Steel (Metal) |
|---|---|---|
| Current Ratio | 2.01 | 1.12 |
| D/E Ratio | 0.00 | 0.72 |
| ROE | 32.4% | 5.8% |
| Reserves & Surplus Growth (3yr) | Positive | Volatile |
Source: NSE filings, Infosys and Tata Steel FY25 Annual Reports. Last updated: June 2026.
Infosys has no debt, and liquidity for the firm is quite good. However, the business of Tata Steel falls under the capital-intensive industry, and a D/E ratio of 0.72 for this company would not be alarming. Using the same standard to compare these companies would paint an inaccurate scenario.
Follow these five steps each time you open a company's balance sheet:
Check shareholders' equity trend over 3 to 5 years. Equity growing steadily means profits are being retained. Equity shrinking or flat signals problems.
Calculate the current ratio. Divide current assets by current liabilities. A ratio below 1.0 means the company cannot cover its short-term obligations with short-term assets.
Calculate the D/E ratio. Divide total borrowings by shareholders' equity. Compare this ratio against the sector average, not a fixed benchmark (see next section).
Check reserves and surplus growth. This line item within equity shows accumulated retained profits. Consistent growth over the years is a positive signal. A sudden fall could mean a large write-off.
Compare 3 to 5 years of data side by side. A single year's balance sheet gives a snapshot. Trends across years reveal whether the company is strengthening or deteriorating. For a strong starting point in fundamentals of stock analysis, trend-reading is the single most valuable skill.
This is the step most retail investors skip. A D/E ratio of 2.0 is not equally alarming across all industries. Capital structure norms vary significantly by sector.
| Sector | Acceptable D/E Range | Current Ratio Benchmark | Why It Differs |
|---|---|---|---|
| IT / Software | 0 to 0.2 | Above 2.0 | Asset-light, cash-rich businesses |
| FMCG | 0 to 0.5 | 1.5 to 2.5 | Low capital needs, high cash flow |
| Pharmaceuticals | 0.3 to 0.8 | 1.5 to 2.0 | R&D capex but generally manageable |
| Auto / Manufacturing | 0.5 to 1.5 | 1.0 to 1.8 | Capex-heavy production cycles |
| Infrastructure / Power | 1.5 to 3.5 | 0.9 to 1.3 | Long-gestation assets funded by long-term debt |
| Banking / NBFC | Not applicable (use Capital Adequacy Ratio instead) | Not applicable | Debt IS the product |
Data sourced from NSE sectoral disclosures and publicly available annual reports. Last updated: June 2026.
A D/E ratio of 2.8 for NTPC (power sector) is within industry norms. The same ratio for an FMCG company would signal serious over-leverage. Always compare a company's ratios against its direct sector peers, not the overall market.
These five warning signs in a balance sheet deserve scrutiny before investing:
D/E ratio rising sharply year-on-year. Aggressive borrowing by an organization that does not see an equivalent growth in assets and profits is one such danger. The debt-to-equity ratio of Videocon Industries exceeded 15 during FY17, many years before it started insolvency procedures.
Current ratio below 1.0 for multiple consecutive quarters. Short-term assets will not suffice to meet short-term obligations. Below 1.0 for one quarter may just reflect seasonality. For three or more quarters, this means a structural liquidity issue.
Receivables are growing faster than revenue. If trade receivables are rising at 25% per year while revenue is growing at 8%, the company is booking sales that are not converting to cash. This pattern is a common precursor to write-offs.
Goodwill is inflating sharply after acquisitions. Goodwill on the balance sheet represents the premium paid over book value for acquired companies. Rapid goodwill growth without business performance improvement often leads to impairment charges that destroy shareholder equity.
Contingent liabilities are increasing. Under SEBI LODR Regulations, listed companies must disclose contingent liabilities (pending litigation, guarantees given) in the balance sheet notes. A large or growing contingent liability figure is an off-balance sheet risk.
During the IL&FS crisis in FY19, the company's balance sheet showed enormous short-term liabilities far exceeding liquid assets. Retail investors who reviewed the current ratio trend across 3 years would have seen the warning well before the default.
Indian retail investors can access balance sheets for free through three official sources:
1. NSE India Go to nseindia.com > Search company name > Select "Financial Results" under the company page > Download the quarterly or annual financial statements.
2. BSE India Go to bseindia.com > Search company code or name > Click "Annual Report" or "Financial Results" > Download the balance sheet PDF.
3. Company's own Investor Relations page Most large-cap companies (Reliance, TCS, HDFC Bank) maintain a dedicated investor relations section on their website with downloadable annual reports and quarterly filings.
Under SEBI LODR Regulation 33, listed companies must file financial results within 45 days of quarter end. Annual results must be filed within 60 days of financial year end.
To screen multiple companies by balance sheet ratios simultaneously without manually downloading each file, the best stock screener on Dhanarthi pulls live balance sheet data across all NSE-listed companies.
The task of reading the balance sheet of one company manually requires effort, while comparing ten companies would take hours. With the help of the software designed by Dhanarthi, these processes become easier to accomplish.
Dhanarthi’s stock screener can assist in filtering stocks based on criteria such as the current ratio, D/E ratio, ROE, and growth in reserves at once, thus eliminating the need to read ten annual reports.
Use the best stock screener to filter all NSE-listed companies by debt-to-equity ratio below 1 and current ratio above 1.5 in under 30 seconds.
The balance sheet will indicate whether a firm is financially healthy or weak on any given date. Analyzing the balance sheet involves the process of assessing three elements (assets, liabilities, equity), four important financial ratios (current ratio, quick ratio, D/E, ROE), and the ratios compared to the relevant industry standards, not absolute figures.
High D/E, low current ratio, and growing receivables have been indicative of failure among Indian firms years ahead of share prices signaling problems. It’s mandatory to perform a thorough balance sheet analysis before any investment.
Disclaimer: This article is for educational purposes only. It does not constitute investment advice. Please consult a SEBI-registered financial advisor before making investment decisions.
1. What is a balance sheet in simple terms?
A balance sheet is a financial statement that shows what a company owns (assets), what it owes (liabilities), and what is left for shareholders (equity) on a specific date. Every listed Indian company publishes this quarterly under the SEBI LODR Regulations 2015. It answers the fundamental question.
2. What are the 3 main parts of a balance sheet?
The three main parts are assets, liabilities, and shareholders' equity. Assets are further divided into current (short-term) and non-current (long-term). Liabilities are also split into current and non-current..
3. How do you read a balance sheet step by step?
Start by checking shareholders' equity growth over 3 to 5 years. Then calculate the current ratio (current assets divided by current liabilities) and the debt-to-equity ratio. Check whether reserves and surplus are growing.
4. What does a good balance sheet look like?
A strong balance sheet shows growing shareholders' equity over multiple years, a current ratio above 1.5, a debt-to-equity ratio within sector norms, and reserves and surplus that are consistently rising. Infosys, for example, carried a D/E ratio of 0.00 and a current ratio of 2.01 in FY25, which reflects an exceptionally clean balance sheet for an IT company (Source: NSE filing, FY25).
5. What should I look for in a company's balance sheet before investing?
Check four things: liquidity (current ratio above 1.5), leverage (D/E ratio within sector norms), equity quality (growing reserves and surplus), and contingent liabilities (disclosed in balance sheet notes).
6. How do I know if a balance sheet is strong?
A balance sheet is strong when current assets comfortably exceed current liabilities, total debt is low relative to equity, reserves and surplus are growing year on year, and there are no large contingent liabilities.
7. What is the difference between a balance sheet and P&L?
The balance sheet shows a company's financial position on one specific date (assets, liabilities, equity). The Profit & Loss (P&L) statement shows revenue, expenses, and profit or loss over a period, typically one quarter or one financial year.
8. What is the current ratio in a balance sheet?
The current ratio is calculated by dividing current assets by current liabilities. It measures a company's ability to pay its short-term dues using short-term assets. A current ratio above 1.5 is generally considered healthy.
9. What is the debt-to-equity ratio in a balance sheet?
The debt-to-equity (D/E) ratio is total debt divided by shareholders' equity. It shows how much of the business is funded by borrowed money versus shareholder funds.
10. How often should you check a company's balance sheet?
Check the balance sheet at a minimum once a year, after the annual report is published. For active investors, reviewing quarterly results is a better practice. SEBI mandates that listed companies publish quarterly financial results within 45 days of each quarter's end, giving investors regular updates on the company's financial position.
Share Market
IPO
Artificial Intelligence
Semi Conductor