





Gold vs Silver Investment India 2026 Returns Compared
November 17, 2026


TABLE OF CONTENTS
Get AI Summary


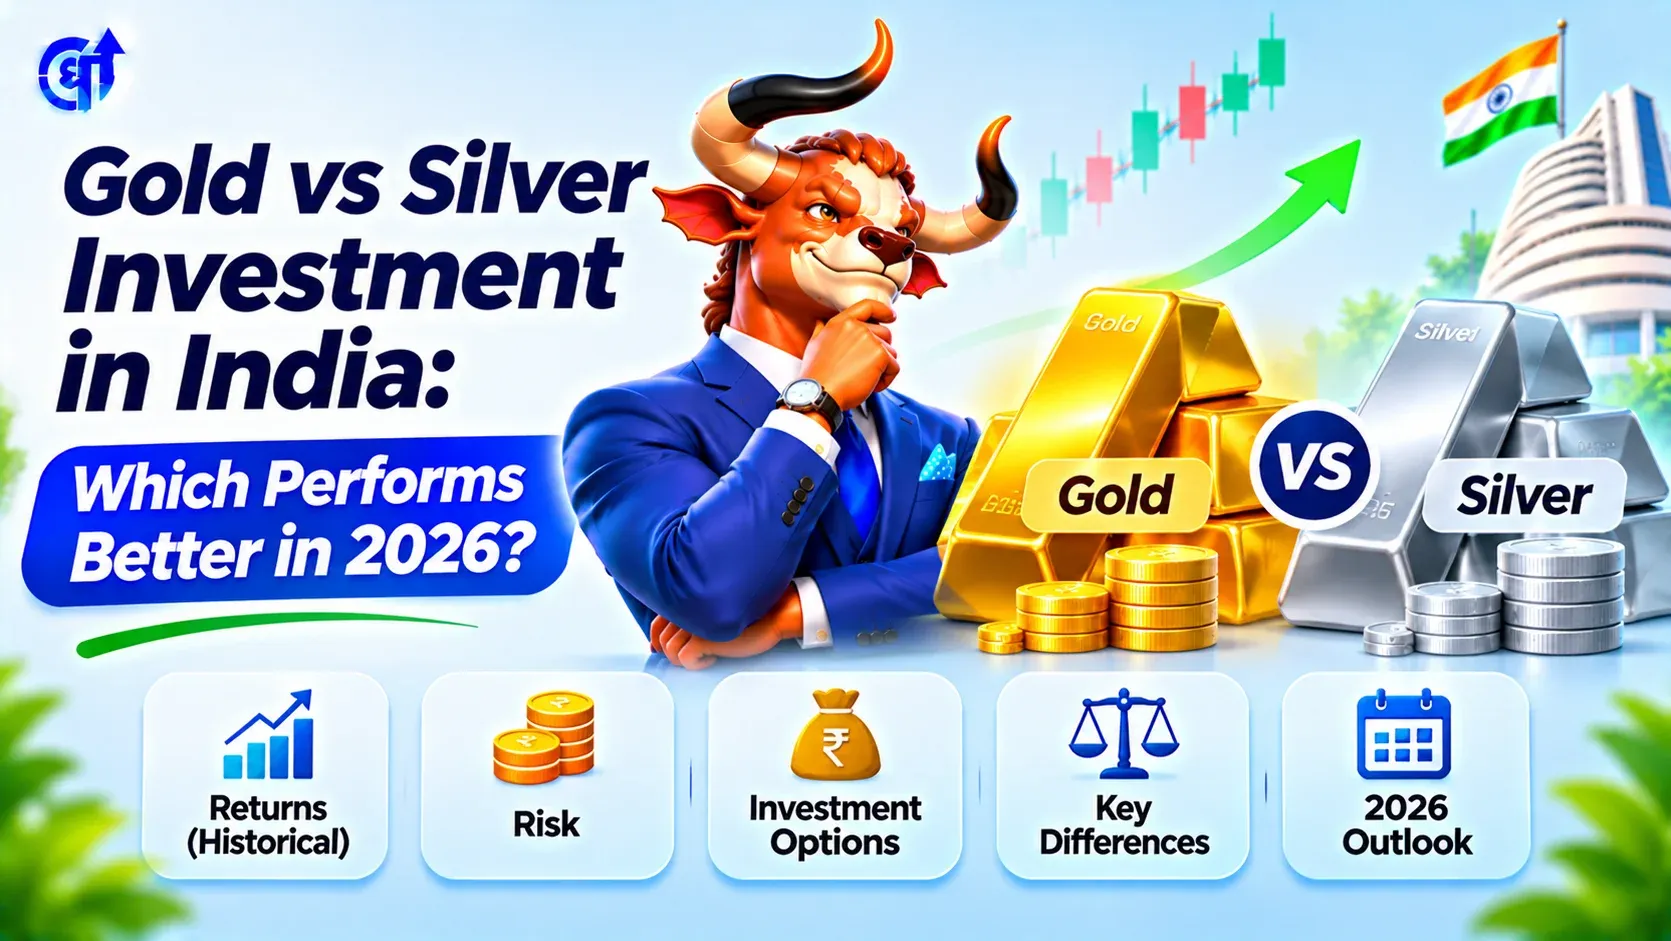
Gold vs silver investment shows mixed results based on recent data. Silver delivered higher returns over 1 and 3 years, turning Rs 1 lakh into about Rs 1.18 lakh and Rs 2.49 lakh respectively. Gold edged ahead over 5 years at 188.09 percent, reaching Rs 2.88 lakh. Gold suits most investors due to lower volatility.
Indian investors often ask which metal to hold in their portfolio. Both gold and silver act as hedges, yet they behave differently. Gold moves mainly with safe-haven demand and central bank buying. Silver combines investment demand with industrial use in solar panels and electronics. Understanding these differences helps you allocate money wisely. Check the fundamentals of stock analysis before adding any asset to your overall plan. Prices fluctuate daily. On 7 November 2026, MCX gold futures traded near Rs 1,42,364 per 10 grams while silver stood around Rs 1,84,977 per kg (Source: ET Now). These levels change with global interest rates, dollar strength and local demand.
Gold demand comes mainly from jewellery, investment and central bank reserves. Jewellery accounts for a large share in India due to cultural preferences. Central banks worldwide added significant quantities in recent years, supporting prices during uncertainty. Silver demand splits between investment and industrial use. Roughly half of global silver consumption goes into solar panels, electronics, electric vehicles and other manufacturing. When industrial activity rises, silver often outperforms. When manufacturing slows, silver can fall faster than gold. This dual nature explains the larger price swings.
Physical gold and silver require secure storage and insurance. Making charges on jewellery reduce the effective investment value immediately. Coins and bars from trusted refiners carry lower charges but still involve GST and storage. Digital options through ETFs eliminate these issues. Units track the metal price minus the small expense ratio. You can buy or sell during market hours on NSE. For gold, Sovereign Gold Bonds issued by the government offer an extra 2.5 percent interest. Maturity after eight years brings tax-free capital gains. These bonds trade on exchanges, so early exit remains possible though subject to market prices.
Investors poured money into gold and silver ETFs through 2026. Gold ETFs saw strong monthly inflows, including Rs 4,451 crore in September 2026, up 71 percent from the prior month (Source: AMFI via CNBC-TV18 and others). Silver ETFs also attracted inflows of about Rs 1,974 crore that month. Category assets grew rapidly as prices rose earlier in the year. Corrections later in 2026 reminded investors of volatility. Gold held value better during the recent pullback. Silver gave back more of its earlier gains. This pattern matches historical behaviour where silver amplifies both upside and downside moves.
Start by deciding your total metals allocation based on overall portfolio size and risk comfort. Review current holdings in equities and debt. Use reliable data sources for the latest AUM, expense ratios and returns of specific ETFs. Compare tracking error if available. Prefer funds with high liquidity for easier entry and exit. Place orders during market hours and check the indicative NAV. Avoid buying large amounts in one go if prices have risen sharply. Spread purchases over weeks if possible. Review the allocation once every six to twelve months and rebalance if metals grow beyond your target percentage.
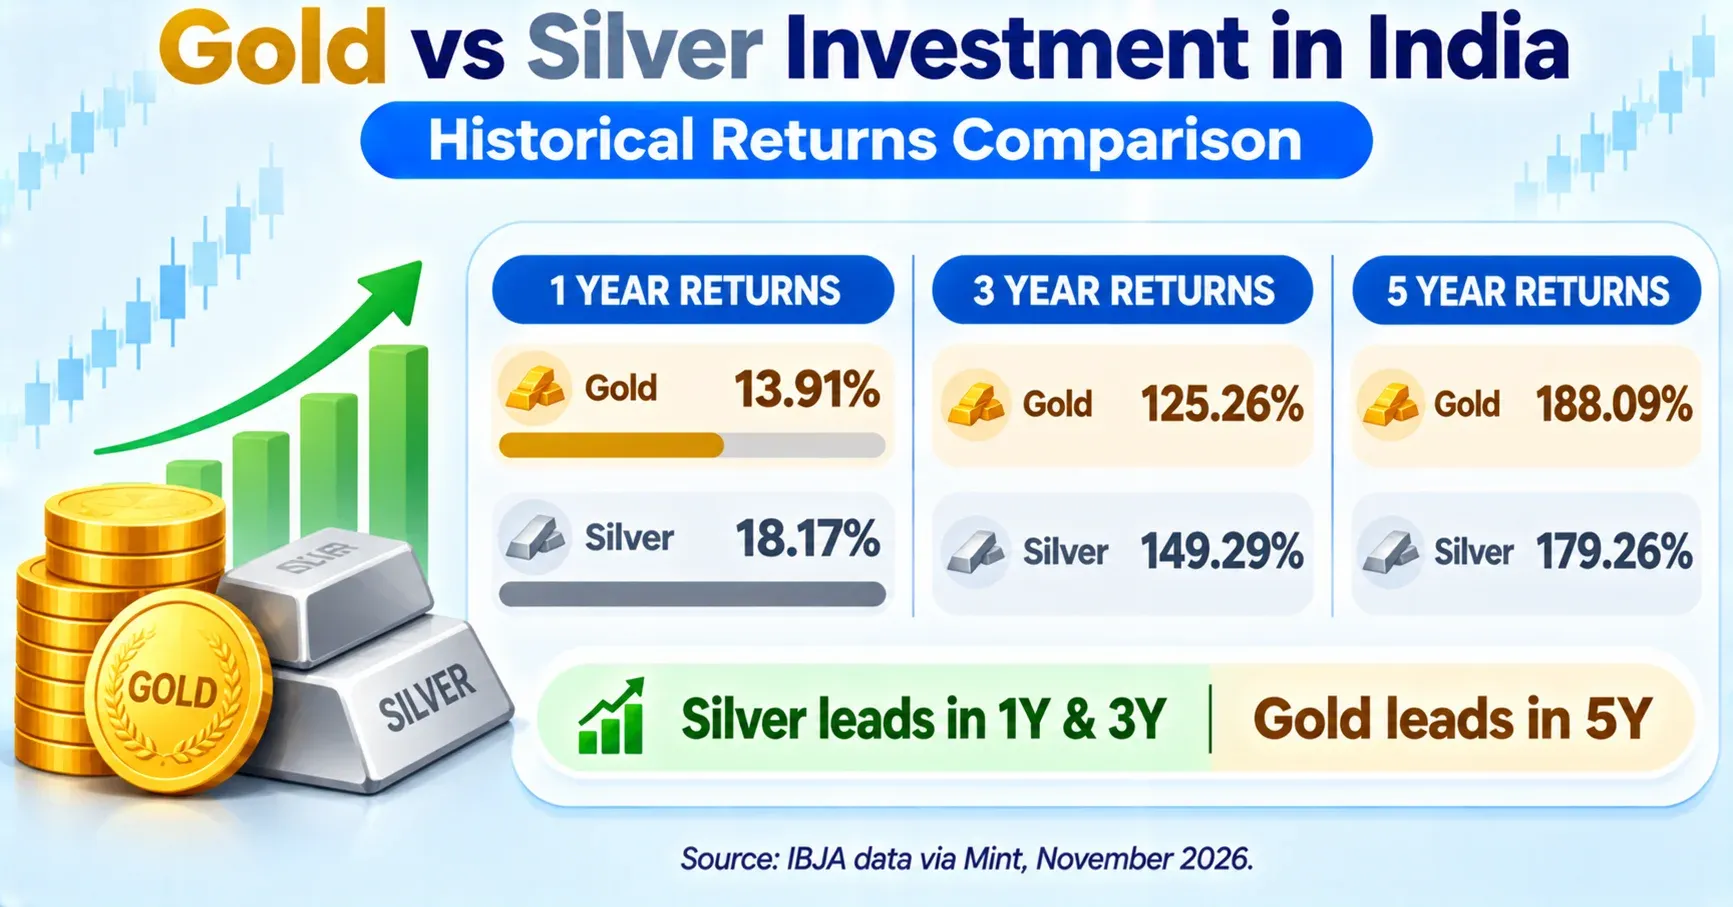
Silver outperformed gold in the short and medium term. A Rs 1 lakh investment in silver on 3 November 2025 grew to around Rs 1.18 lakh by 3 November 2026. The same amount in gold reached about Rs 1.14 lakh. Over three years, silver returned 149.29 percent while gold returned 125.26 percent. Over five years, gold led with 188.09 percent against silver’s 179.26 percent (Source: IBJA rates via Mint, 4 November 2026).
| Period | Gold Return | Value of Rs 1 Lakh in Gold | Silver Return | Value of Rs 1 Lakh in Silver |
|---|---|---|---|---|
| 1 Year | 13.91% | Rs 1.14 lakh | 18.17% | Rs 1.18 lakh |
| 3 Years | 125.26% | Rs 2.25 lakh | 149.29% | Rs 2.49 lakh |
| 5 Years | 188.09% | Rs 2.88 lakh | 179.26% | Rs 2.79 lakh |
Data sourced from IBJA via Mint. Last updated: November 2026.
Longer periods favour gold for smoother growth. A 21-year Dhanteras study showed gold compounding at 15.4 percent annually and silver at 13.8 percent (Source: Kotak Neo / ET Now, November 2026). Past cycles confirm this pattern. Gold protected capital better during equity crashes while silver amplified gains during industrial recoveries. Investors who held both metals across multiple years reduced overall portfolio swings.
ETFs offer a simple way to own both metals without storage hassles. Gold ETFs held Rs 1.91 lakh crore across 26 schemes as of August 2026. Silver ETFs held Rs 85,488 crore across 19 schemes (Source: AMFI Monthly Report, August 2026). Nippon India ETF Gold BeES alone managed about Rs 58,630 crore as of late August 2026 (Source: FinPlann compilation of AMFI data). As of September 2026, gold ETF AUM stood near Rs 1.86 lakh crore despite a monthly correction (Source: Business Standard citing ICRA Analytics).
Silver ETFs delivered higher average one-year returns of around 25 percent versus 15.8 percent for gold ETFs recently (Source: Value Research data cited by Mint, November 2026). Over three months, silver ETFs fell more sharply, highlighting higher volatility. Nippon India Silver ETF remains the largest silver product by assets and trading volume. Expense ratios range from 0.35 percent for some silver ETFs to 0.81 percent for the largest gold ETF. Liquidity stays high for top funds, with daily traded value often exceeding Rs 25 crore for leading products.
Physical bars and coins work for some, yet they carry making charges, GST of 3 percent, and storage costs. Gold ETFs and Silver ETFs trade on NSE like stocks and track domestic prices closely. Sovereign Gold Bonds remain available for gold only. They pay 2.5 percent annual interest and offer tax-free gains if held to maturity. No similar product exists for silver.
Digital gold platforms allow small purchases. Futures on MCX suit experienced traders only due to leverage and rollover costs. Most retail investors stick to ETFs or SGBs for simplicity and liquidity. MCX gold futures traded near Rs 1,42,000 per 10 grams in early November 2026 while silver futures hovered around Rs 1,85,000 per kg (Source: recent MCX quotes via ET Now and Economic Times). These levels reflect the latest market moves after festival demand.
Silver moves more than gold. Industrial demand makes silver prices swing harder during economic shifts. Recent three-month data showed silver ETFs down about 17 percent while gold ETFs declined around 4 percent (Source: Mint citing Value Research, November 2026). Gold held up better during equity market stress in past cycles, such as 2008 and 2011. In 2008, gold gained while equities fell sharply. Similar protection appeared in other down years.
Investors who bought silver after big rallies often faced 30-50 percent corrections. Gold drawdowns stay smaller. A common mistake is allocating too much to silver without accepting the larger price swings. Central bank buying supports gold more consistently. RBI and other central banks added tonnes of gold in recent years, providing a floor under prices. Silver lacks this steady institutional demand and relies more on manufacturing cycles.
Most advisors suggest 5-10 percent of a portfolio in precious metals. Of that, many keep the larger share in gold and a smaller portion in silver. A 70:30 gold-to-silver split inside the metals allocation suits conservative investors. Aggressive investors may go closer to 50:50. Use a stock screener to balance metals with equity holdings based on your risk level.
Rebalance once a year. Buy on dips rather than chasing peaks. Gold-silver ratio above 80 often signals silver is relatively cheaper historically. Current ratios have moved lower after silver’s strong run. A practical example: an investor with Rs 10 lakh portfolio might place Rs 50,000-70,000 in gold ETFs and Rs 20,000-30,000 in silver ETFs. This keeps metals as a diversifier without dominating returns from equities or debt.
Physical gold, silver, ETFs and mutual funds follow similar capital gains rules. Holdings under two years attract tax as per your income slab. Holdings over two years face 12.5 percent long-term capital gains without indexation. Sovereign Gold Bonds held to eight-year maturity give tax-free capital gains plus the interest. Selling SGBs on the exchange before maturity follows the same two-year rule as other gold products.
Gold works for investors who want stability and an inflation hedge. It suits beginners and those building a core portfolio. Silver fits investors with higher risk tolerance who believe industrial demand from solar and electronics will stay strong. Silver can boost returns in growth phases but requires patience during corrections.
A balanced approach of holding both metals reduces the chance of missing gains in either. Track overall portfolio performance rather than metal prices alone. Beginners start with gold ETFs. Intermediate investors add a silver sleeve once they understand the volatility. Advanced investors may use the gold-silver ratio for tactical shifts, but most stick to fixed allocations.
Many investors buy physical jewellery for investment and lose 10-25 percent to making charges. Others chase silver after large rallies and sell at lows. Ignoring expense ratios in ETFs also reduces returns over time. Nippon India ETF Gold BeES carries a higher expense ratio of 0.81 percent compared with some peers at 0.35-0.49 percent. Liquidity matters more than the lowest fee for large trades. Another error is treating metals as a short-term trade instead of a multi-year hedge. Festival buying often leads to higher prices that later correct.
Gold vs silver investment depends on your time horizon and risk comfort. Silver has led recently over shorter periods while gold provides steadier long-term growth. Most Indian investors benefit from a larger gold allocation inside a small overall metals holding. Use ETFs for ease and SGBs for gold if tax efficiency matters. Review your full portfolio regularly with proper analysis tools. The AI Financial Research Assistant can help check how metals fit your existing holdings.
This article is for educational purposes only. It does not constitute investment advice. Please consult a SEBI-registered financial advisor before making investment decisions.
1. Is gold or silver a better investment in India right now?
Silver has delivered higher returns over the past one and three years based on IBJA data as of early November 2026. Gold has shown stronger five-year returns and lower volatility. Most investors keep a larger share in gold for stability.
2. How much should I allocate to gold and silver?
Financial advisors often suggest 5-10 percent of the total portfolio in precious metals. Within that, a 70 percent gold and 30 percent silver split works for conservative investors. Adjust based on your risk tolerance.
3. What is the best way to invest in gold and silver in India?
Gold ETFs and Silver ETFs offer liquidity without storage costs. Sovereign Gold Bonds provide tax-free maturity gains for gold. Physical bars work if you prefer tangible assets, but factor in making charges and GST.
4. Are silver ETFs riskier than gold ETFs?
Yes. Silver prices move more due to industrial demand. Recent data showed larger short-term declines in silver ETFs compared with gold ETFs. Expect higher swings if you hold silver.
5. Do gold and silver ETFs pay dividends?
No. Both gold and silver ETFs track metal prices and do not distribute dividends. Returns come only from price changes. Expense ratios of 0.35-0.81 percent apply annually.
Share Market
IPO
Artificial Intelligence
Semi Conductor