





Sector Rotation Strategy India: How to Invest Across Sectors
November 5, 2026


TABLE OF CONTENTS
Get AI Summary



Sector rotation India means shifting money between industry groups as their relative strength against the Nifty 50 changes with the economic cycle, interest rates and earnings. On 4 November 2026, Media rose 5.15 percent while IT fell 1.50 percent, showing how leadership moves daily even inside a rising market.
Indian retail investors often stay in one sector for years and miss the next leaders. Sector rotation gives a simple way to stay with strength instead of hoping a lagging sector turns around. This approach uses relative performance data from NSE sector indices, not tips or forecasts. Learning the basics of fundamental analysis helps you evaluate the companies you find inside leading sectors.
You can start with basic relative strength checks before you pick individual stocks. The stock screener on Dhanarthi helps filter companies inside the sectors that are currently leading.
Research Stocks Smarter with Dhanarthi AI Screener
Analyze 5,000+ NSE & BSE stocks with 150+ custom filters, real-time volume breakout scans, and transparent fundamental data.
Use Dhanarthi Screener
Sector rotation is the pattern where capital moves from one industry group to another as conditions change. Banking and auto often lead early in a recovery. Capital goods and metals lead in the expansion phase. Defensive sectors such as pharma and FMCG hold up better when growth slows.
In India the drivers are clear. FII and DII flows concentrate in certain sectors for months. RBI rate decisions affect banks and real estate faster than IT. Commodity prices move metal and oil & gas. Quarterly results shift money between groups every three months.
NSE publishes more than 20 sector indices. Comparing their returns against Nifty 50 shows which groups are leading or lagging. A sector can rise in absolute terms yet still lag the index. Relative strength matters more than absolute returns for rotation decisions.
Historical cycles show the same pattern. After the 2020 bottom, banks and auto recovered first as credit growth returned and vehicle sales rebounded. In 2022-23, capital goods and infrastructure led as government capital expenditure rose sharply and private capex followed. Pharma and IT have rotated in and out of leadership depending on global demand, rupee moves and US interest rate expectations. These past cycles give context but the current relative strength ranking is more useful for decisions than history alone.
FII flows often drive the early part of a rotation. When foreign investors increase exposure to India, they typically buy large-cap banking and IT stocks first. Domestic institutions later rotate into mid-cap industrial and consumption names. Watching both FII and DII monthly data from SEBI helps confirm whether a sector move has institutional support.
RBI policy also creates clear rotation points. Rate cuts usually help banks through higher margins and real estate through lower borrowing costs. Rate hikes or tight liquidity hurt those groups and favour defensive sectors with stable cash flows. Commodity price swings add another layer. Rising crude supports oil marketing companies in the short term but pressures auto and FMCG margins. Metal prices track global demand and the dollar.
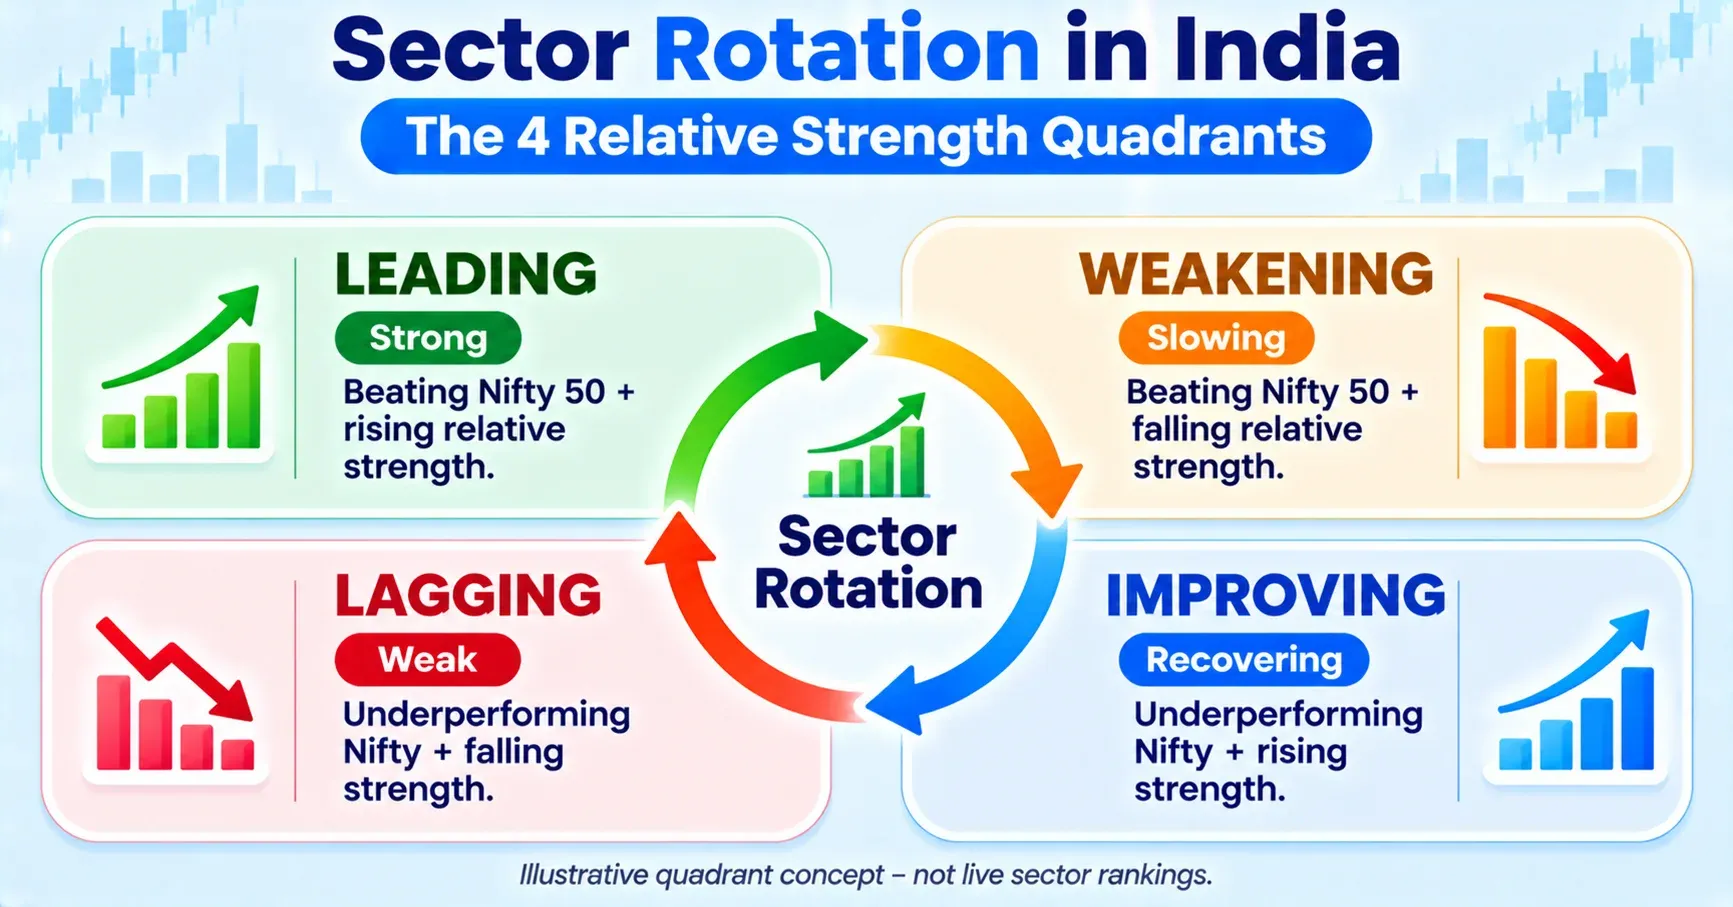
Start with the official NSE sector indices. Calculate or look up the 1-month and 3-month return of each sector versus Nifty 50. Sectors that beat the index for both periods and show rising relative strength are in leadership.
Four simple quadrants help:
You do not need complex software. Most free charting platforms let you plot a sector index divided by Nifty 50. A rising line means the sector is outperforming. Add a 20-week moving average. When the ratio crosses above the average, relative strength is turning positive.
Check breadth inside the sector. If more than 60 percent of stocks in a sector trade above their 50-day moving average, the move is broad and more reliable. Narrow leadership in only two or three heavyweights is riskier because those stocks can reverse quickly and drag the index down. You can check breadth on most free platforms by looking at the advance-decline ratio for the sector or simply scanning the list of constituent stocks.
Volume confirmation adds another filter. Rising volume on up days in the sector index suggests real buying interest rather than short covering. Falling volume on advances is a warning sign. Most retail investors skip this step, yet it filters out many false signals.
Once a sector ranks high on relative strength and shows healthy breadth, the next step is stock selection inside that group. A stock screener lets you apply the same fundamental filters you would use for any long-term holding. This keeps the process consistent instead of buying random names just because the sector is hot.
On 4 November 2026 the market closed higher. Nifty 50 ended at 23,960.60, up 0.63 percent. Seventeen of eighteen major NSE sector indices rose. Media led with a 5.15 percent gain. IT was the only major laggard, down 1.50 percent.
| Sector Index | Close (4 Nov 2026) | 1-Day Change | 1-Month Change |
|---|---|---|---|
| Media | 1,710.65 | +5.15% | +9.6% |
| Realty | 865.40 | +2.85% | +3.1% |
| Metal | 12,485.90 | +2.80% | -0.1% |
| Energy | 37,078.85 | +2.17% | +1.3% |
| FMCG | 46,264.05 | +1.50% | +3.8% |
| Bank | 55,913.60 | +0.67% | +2.2% |
| IT | 32,061.90 | -1.50% | +13.3% |
Data sourced from NSE index files. Last updated: November 2026.
Media showed both strong absolute and relative performance over one month. IT had strong one-month absolute gains earlier but lagged on the latest day as money rotated into domestic-facing sectors. Longer-term data as of early November 2026 shows Nifty Pharma up about 23 percent over one year and Nifty Metal up about 20 percent, while many consumption sectors lagged.
These numbers change every session. Use them as a starting point, then verify the latest relative strength before acting. One-month returns can reverse quickly, so the three-month relative ranking usually gives a more stable signal for portfolio allocation decisions. Investors who chase the single best one-day or one-week sector often end up buying near the peak of a short-term move.
Comparing sectors against each other also helps. Media outperforming Metal on a given day does not mean Media is the better longer-term holding if Metal has stronger three-month relative strength and better breadth. Rank all major sectors together rather than focusing on only the top one or two names in the news.
This is not a daily trading system. Most retail investors review sector ranks once a week or once a month. The goal is to avoid staying fully invested in sectors that have already peaked in relative strength. Transaction costs and taxes make frequent switches expensive for long-term investors. A monthly review keeps costs low while still allowing timely adjustments when relative rankings change clearly.
Portfolio construction remains important. Even when a sector is leading, diversification across two or three sectors reduces the impact if one group reverses. Many investors keep a core allocation in broad Nifty or Sensex funds and use 20-30 percent of the equity portion for sector rotation. This balances participation in leadership with overall market exposure.
Example: In late 2026, if Media and Metal show improving relative strength while IT weakens, an investor can reduce IT weight and add quality names from the improving sectors after checking financials.
HDFC Bank reported Q2 FY27 standalone net profit of Rs 19,510 crore, up 4.7 percent year-on-year. Net interest income rose 9.7 percent to Rs 34,620 crore (Source: company filing, October 2026). The bank remains a core name in the financials sector. When banking shows relative strength, quality private banks like this one usually participate.
Reliance Industries reported Q2 FY27 consolidated net profit of approximately Rs 25,548 crore, up over 40 percent year-on-year in one filing, driven by strong oil-to-chemicals performance (Source: company results, October 2026). Energy and oil & gas sectors respond to crude prices and refining margins. When these sectors improve on relative strength charts, Reliance often leads.
Both companies appear in multiple NSE sector indices. Checking their latest quarterly numbers on the exchange filings gives context before adding them during a sector rotation move. Fundamentals still matter even when the sector is leading.
Chasing the hottest sector after it has already risen 30-40 percent relative to Nifty is the most frequent error. By the time media coverage peaks, relative strength often starts to weaken.
Ignoring breadth is another mistake. A sector index can rise because of two large stocks while most other names lag. Check how many stocks inside the sector are above their moving averages.
Over-concentrating is risky. Putting 50 percent of the portfolio into one sector because it is leading works until the rotation reverses. Historical data shows sectors can lag for 12-18 months after a strong run.
Finally, using only absolute returns instead of relative returns leads to buying sectors that rise less than the market. Relative strength against Nifty 50 is the clearer signal.
Sector rotation tells you where money is moving. Fundamental analysis tells you which companies inside that sector are worth owning. Use both.
After identifying a leading sector, run a screen for companies with:
The financial analysis tools help you read balance sheets and cash flow statements of the shortlisted names. Strong cash flow and low debt reduce the chance that a sector leader turns into a problem stock.
Reviewing conference call transcripts and annual reports adds context on management commentary about demand and margins. This step takes time but improves results compared with buying the sector index ETF alone.

Confused about chart patterns & stock analysis?
Use
Dhanarthi Stock Guru
to chat, analyze price patterns, and ask questions directly.
Sector rotation in India is a practical way to stay aligned with where institutional money is moving. It uses publicly available NSE sector index data and relative strength against Nifty 50. The process is simple enough for intermediate investors: rank sectors weekly or monthly, focus on Leading and Improving groups, then apply fundamental filters inside those groups.
On 4 November 2026, Media led while IT lagged, a clear example of daily rotation even in a rising market. Longer-term cycles show banking, capital goods, metals, pharma and IT taking turns. Combining this view with company-level analysis reduces the risk of holding lagging sectors for too long.
Start with the latest sector performance table, check relative strength, and screen for quality companies inside the stronger groups. Review the allocation every month and adjust as the rankings change.
This article is for educational purposes only. It does not constitute investment advice. Please consult a SEBI-registered financial advisor before making investment decisions.
1. What is sector rotation in the Indian stock market?
Sector rotation is the shift of capital between industry groups such as banking, IT, metals and pharma as their relative performance against the Nifty 50 changes. It follows economic cycles, interest rates and earnings trends. Investors use NSE sector index data to identify which groups are currently leading.
2. How often should I rebalance for sector rotation?
Most retail investors review sector rankings once a month. Weekly checks are enough for active traders. Daily trading based on sector moves increases costs and often captures noise instead of the underlying trend. Monthly reviews keep the process simple and low-cost.
3. Can beginners use sector rotation?
Yes. Start by tracking five or six major NSE sector indices against Nifty 50. Focus on relative strength rather than absolute returns. After identifying a leading sector, use a stock screener to find companies with strong ROE and low debt before buying individual stocks.
4. Which sectors usually lead in different market phases?
Early recovery often sees banking and auto lead. Mid-cycle expansion favours capital goods, infrastructure and metals. Slowdowns see pharma, FMCG and sometimes IT hold up better. These are tendencies based on past cycles, not fixed rules. Relative strength data shows the current phase more clearly than theory.
5. Does sector rotation work with mutual funds or ETFs?
Yes. Sectoral mutual funds and ETFs exist for most major NSE sectors. You can shift allocation between these funds based on relative strength rankings. This reduces single-stock risk compared with buying individual companies, though expense ratios and tracking error still apply.
Share Market
IPO
Artificial Intelligence
Semi Conductor