



What is RSI (Relative Strength Index)? Meaning & Formula
August 15, 2026



TABLE OF CONTENTS
Get AI Summary





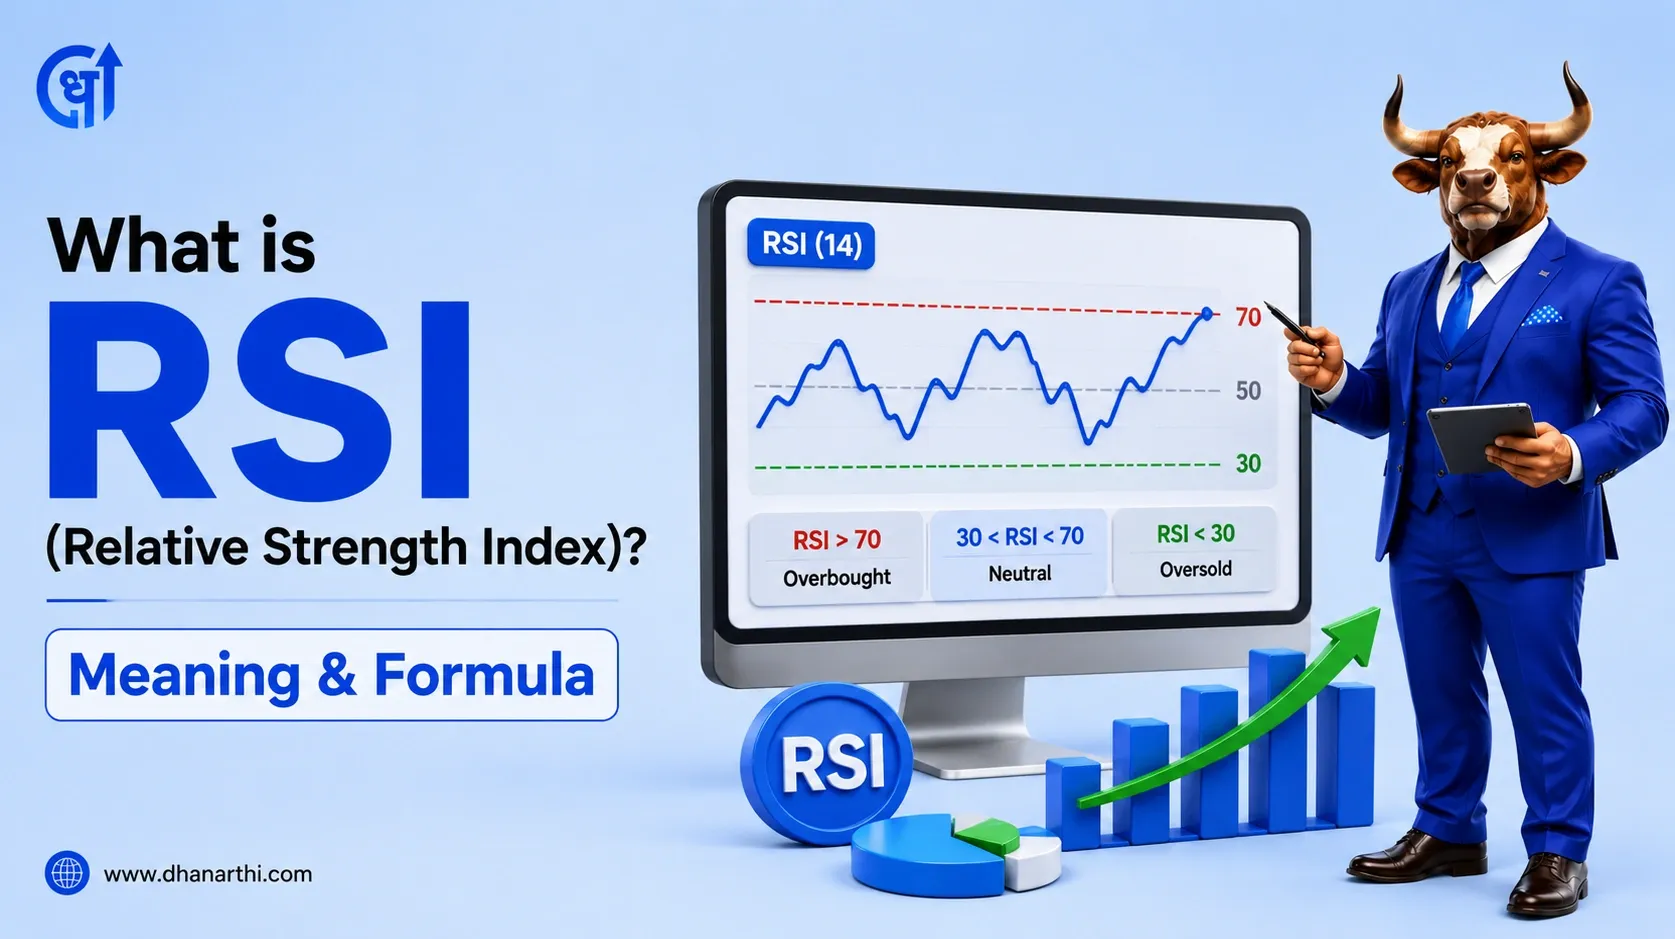
RSI (Relative Strength Index) is a momentum indicator that measures the speed and size of recent price moves on a scale of 0 to 100. Traders use RSI to spot overbought conditions above 70 and oversold conditions below 30. Developed by J. Welles Wilder, RSI helps identify potential trend reversals in stocks, indices, and other assets.
RSI stands for Relative Strength Index. It is a momentum oscillator, meaning it moves up and down between fixed limits (0 to 100) rather than tracking price directly. J. Welles Wilder introduced RSI in his 1978 book "New Concepts in Technical Trading Systems," and it remains one of the most widely used indicators among Indian F&O and equity traders today.
RSI in stock market terms answers one question: are recent price gains outpacing recent price losses, or the other way around? A stock that has rallied hard for two weeks will show a high RSI. A stock that has fallen sharply will show a low RSI. For a broader look at how momentum tools fit into fundamental analysis of stock analysis, RSI is usually one of the first indicators Indian retail traders learn on platforms like Zerodha Kite or Upstox Pro.
The RSI full form in stock market context is Relative Strength Index. RSI meaning in stock market is simple: it is a mathematical comparison of average gains versus average losses over a fixed lookback period, most commonly 14 trading days.
RSI is not the same as "relative strength," which compares one stock against another stock or an index. RSI compares a stock only against its own recent price history.
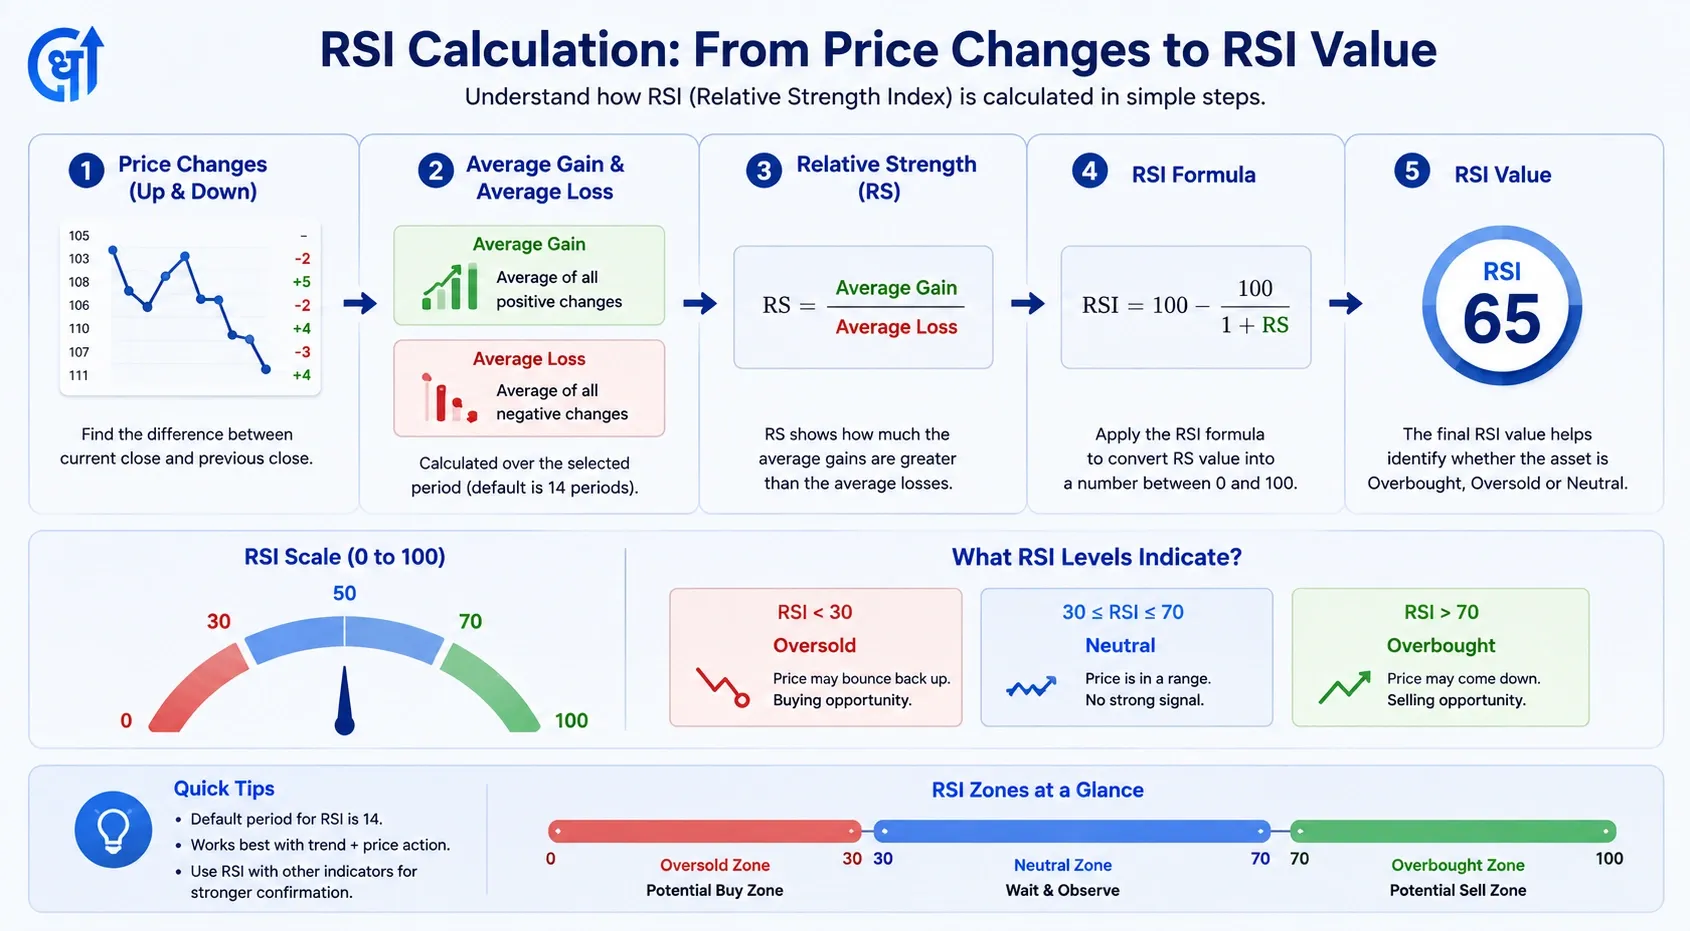
RSI formula:
RSI = 100 - [100 / (1 + RS)]
Where RS (Relative Strength) = Average Gain over 14 periods / Average Loss over 14 periods
Step-by-step calculation:
| Step | Action |
|---|---|
| 1 | Pick a lookback period, usually 14 days |
| 2 | Calculate average gain on up-days over 14 days |
| 3 | Calculate average loss on down-days over 14 days |
| 4 | Divide average gain by average loss to get RS |
| 5 | Plug RS into the RSI formula above |
Worked example: If a stock had an average gain of Rs 4 per day and an average loss of Rs 2 per day over 14 sessions, RS = 4/2 = 2. RSI = 100 - [100/(1+2)] = 100 - 33.3 = 66.7. This stock is approaching overbought territory but has not crossed 70 yet.
Most Indian brokers, including Zerodha Kite, Upstox, and TradingView India, calculate this automatically. You do not need to compute it by hand while trading live.
| RSI Level | Market Condition | Typical Interpretation |
|---|---|---|
| Above 70 | Overbought | Stock may be due for a pullback |
| 50 to 70 | Bullish momentum | Uptrend intact |
| 30 to 50 | Bearish momentum | Downtrend intact |
| Below 30 | Oversold | Stock may be due for a bounce |
An RSI indicator for stocks reading above 70 does not mean sell immediately. Strong trending stocks can stay overbought for weeks. RSI works best as a confirmation tool, not a standalone buy or sell signal.
Most beginners assume RSI always swings between 0 and 100 in the same way. In practice, the range shifts depending on the broader trend.
During a strong uptrend, RSI on a stock relative strength index chart tends to stay between 40 and 90, with the 40-50 zone acting as support rather than a sell signal. During a strong downtrend, RSI tends to stay between 10 and 60, with the 50-60 zone acting as resistance.
This matters because a trader who sells every time RSI touches 70 in a strong bull run, like many Nifty 50 IT stocks during a sustained rally, will exit far too early and miss the bulk of the move.
RSI divergence happens when price and RSI move in opposite directions, signaling that the current trend may be losing strength.
Bearish divergence: Price makes a new high, but RSI makes a lower high. This suggests buying pressure is weakening even though the stock is still rising.
Bullish divergence: Price makes a new low, but RSI makes a higher low. This suggests selling pressure is weakening even though the stock is still falling.
Indian index traders often watch for RSI divergence on the Nifty 50 and Bank Nifty during extended rallies or sell-offs, since index-level divergence can signal a broader market turning point before individual stocks confirm it.
For traders learning how to use RSI indicator effectively, three approaches are common among Indian retail traders:
RSI is not flawless. Common limitations include:
A common mistake among beginner Indian traders is acting on RSI 70/30 crossovers alone without checking price action, support and resistance zones, or volume confirmation. RSI works better when combined with moving averages, MACD, or basic candlestick pattern confirmation rather than used in isolation.
For traders who want a research assistant to cross-check technical signals against company fundamentals before acting, the Dhanarthi AI Financial Research Assistant can help validate whether a technically overbought or oversold stock also has weak or strong underlying fundamentals.
| Indicator | Measures | Best Used For |
|---|---|---|
| RSI | Speed and change of price moves (0-100 scale) | Overbought/oversold zones, divergence |
| MACD | Relationship between two moving averages | Trend direction and momentum shifts |
| Stochastic Oscillator | Closing price relative to price range | Short-term reversal timing |
Data sourced from NSE and standard technical analysis references.
RSI meaning in stock market comes down to one idea: it measures whether recent price momentum favors buyers or sellers, on a simple 0 to 100 scale. Used alone, RSI can mislead traders during strong trends. Used alongside price action, volume, and other indicators, it becomes one of the more reliable tools for timing entries and exits in Indian equity and derivatives markets.
Disclaimer: This article is for educational purposes only. It does not constitute investment advice. This is not a recommendation to buy or sell any security named above. Please consult a SEBI-registered financial advisor before making investment decisions.
1. What is RSI in stock market?
RSI, or Relative Strength Index, is a momentum indicator that measures the speed and size of recent price changes on a 0 to 100 scale. It helps traders identify overbought and oversold conditions in a stock.
2. What is RSI full form in stock market?
RSI full form in stock market is Relative Strength Index. It was developed by J. Welles Wilder in 1978 and remains one of the most widely used momentum indicators.
3. How to calculate RSI?
RSI is calculated using the formula RSI = 100 - [100/(1+RS)], where RS is the average gain divided by the average loss over a set period, usually 14 days. Most trading platforms calculate this automatically.
4. What is a good RSI for buying a stock?
There is no fixed good RSI level. Many traders watch for RSI near 30 as a potential buying zone, but confirmation with price action and volume is important before acting.
5. What does RSI above 70 mean?
RSI above 70 typically indicates a stock is overbought, meaning it has risen sharply and may be due for a pause or pullback. In strong uptrends, RSI can stay above 70 for extended periods.
6. What does RSI below 30 mean?
RSI below 30 typically indicates a stock is oversold, meaning it has fallen sharply and may be due for a bounce. This does not guarantee an immediate reversal.
7. What is RSI divergence?
RSI divergence occurs when price and RSI move in opposite directions. Bearish divergence happens when price makes a new high but RSI does not, while bullish divergence happens when price makes a new low but RSI does not.
8. Can RSI be used alone for trading decisions?
RSI works best when combined with other tools like moving averages, volume, or support and resistance levels. Using RSI alone can lead to false signals, especially in sideways markets.
9. What is the best RSI period for Indian stocks?
The default 14-period RSI is the most widely used setting for Indian equities and works well for both short-term and swing trading. Some traders adjust to 9 or 21 periods depending on their trading style.
10. Is RSI useful for intraday trading in India?
Yes, RSI is commonly used in intraday trading on shorter timeframes like 5-minute or 15-minute charts, though signals tend to be noisier and require faster confirmation compared to daily charts.
Share Market
IPO
Artificial Intelligence
Semi Conductor