





Sector Wise PE Ratio in India: Complete Table
October 15, 2026



TABLE OF CONTENTS
Get AI Summary





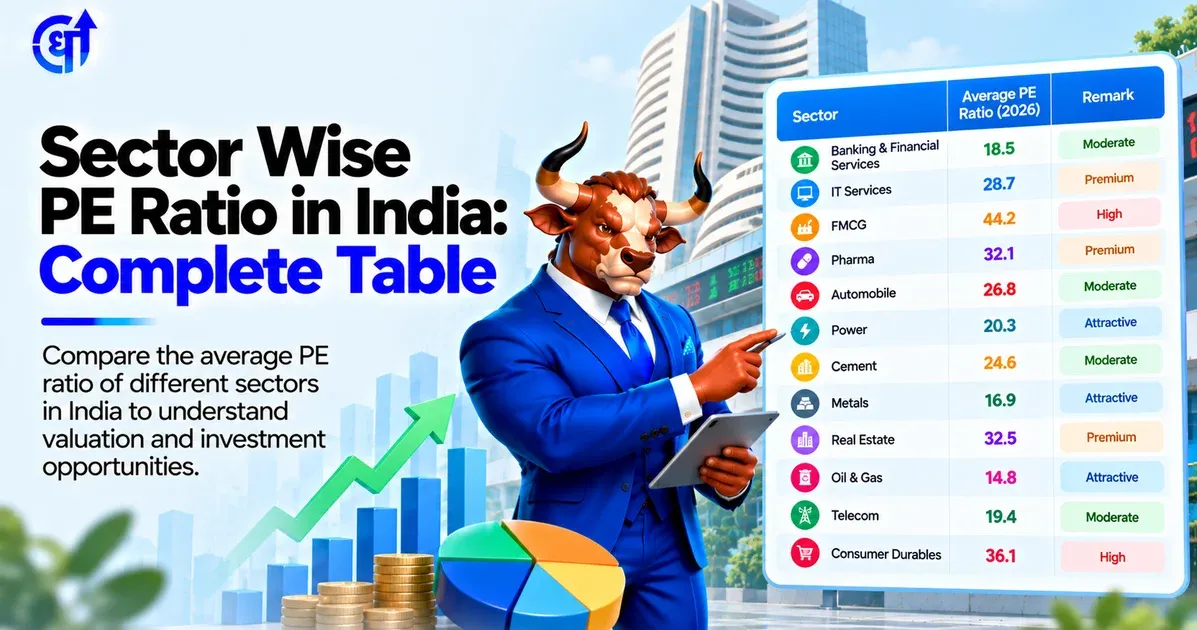
Sector wise PE ratio India shows how much investors pay for each rupee of earnings across different industries. As of 14 October 2026, Nifty PSU Bank trades at the lowest PE of 7.34 while Nifty Consumer Durables sits at the highest of 58.64. Banks and oil and gas remain cheap relative to the Nifty 50 PE of 19.4, while healthcare, pharma and consumer durables command clear premiums. (Source: Flash Finance index valuations, 14 October 2026.)
Investors track sector wise PE ratio India to spot where valuations sit relative to history and to the broader market. A low sector PE does not automatically mean a buy. It simply flags that earnings expectations or risk perceptions differ from other parts of the market. You can compare these numbers against the full list of Indian stock market sectors to see which industries drive the Nifty and which remain under-owned.
Sector wise PE ratio is the price-to-earnings multiple of a sector index or the median PE of stocks inside that sector. NSE calculates it for its official sectoral indices using trailing twelve-month earnings of the constituent companies.
A PE of 15 means investors pay Rs 15 for every Rs 1 of past earnings. Cyclical sectors such as metals and oil and gas usually trade at lower PEs because earnings swing sharply with commodity prices. Defensive or high-growth sectors such as healthcare and consumer durables often trade higher because earnings are steadier or expected to grow faster.
Comparing sectors only on absolute PE misses the point. A bank PE of 12 can be expensive if the 10-year average is 9. An IT PE of 19 can be cheap if the long-term average is 27. Always check the sector PE against its own history and against the Nifty 50.
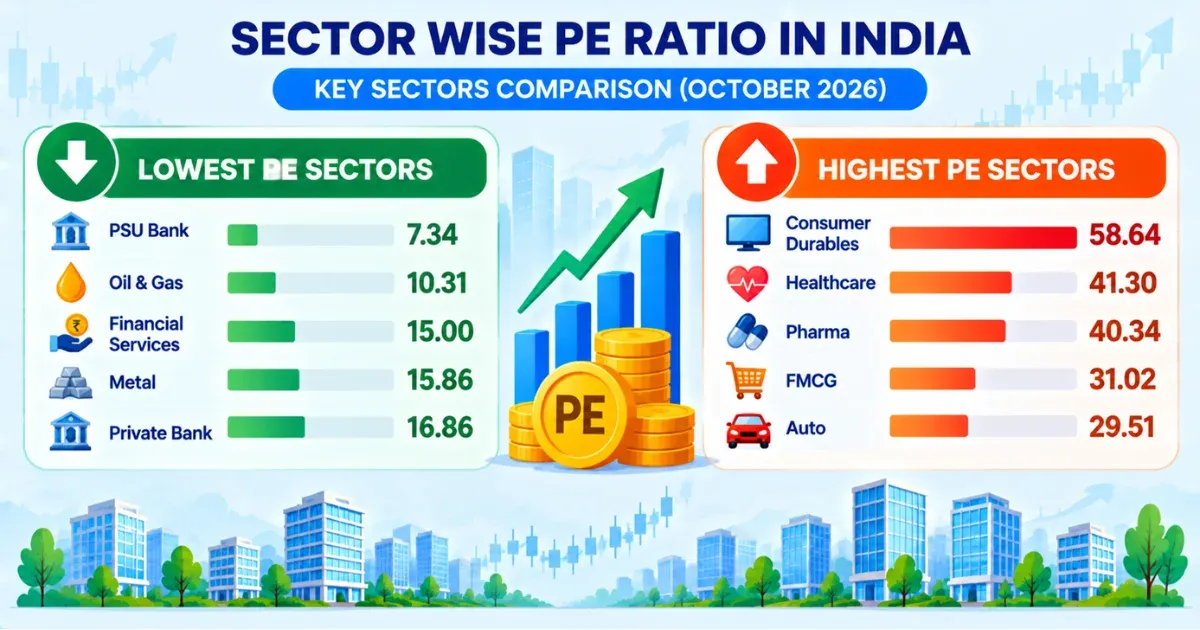
The table below lists official NSE sectoral index PEs as of the close on 14 October 2026. Data comes from index valuation pages that pull NSE figures.
| Sector Index | PE Ratio | PB Ratio | Dividend Yield | 1-Year Return |
|---|---|---|---|---|
| Nifty PSU Bank | 7.34 | 1.13 | 2.57% | +7.5% |
| Nifty Oil & Gas | 10.31 | 1.28 | 3.38% | -7.9% |
| Nifty Financial Services | 15.00 | 2.37 | 1.10% | -7.6% |
| Nifty Metal | 15.86 | 2.57 | 1.66% | +18.7% |
| Nifty Private Bank | 16.86 | 1.96 | 0.66% | -1.9% |
| Nifty IT | 18.51 | 5.22 | 3.80% | -14.3% |
| Nifty Auto | 29.51 | 3.97 | 1.15% | -5.6% |
| Nifty FMCG | 31.02 | 7.43 | 2.58% | -16.5% |
| Nifty Pharma | 40.34 | 4.91 | 0.57% | +16.8% |
| Nifty Healthcare | 41.30 | 5.24 | 0.51% | +6.7% |
| Nifty Consumer Durables | 58.64 | 9.40 | 0.46% | -3.4% |
Data sourced from Flash Finance (NSE index valuations). Last updated: 14 October 2026.
Nifty 50 PE stood at 19.41 on the same date (Source: Flash Finance). Most cyclical and financial indices trade below this level. Healthcare, pharma and consumer durables trade well above it.
Median stock PEs inside broader sectors sometimes differ from index PEs because large companies dominate the index calculation. For example, the median PE across banking stocks was around 10.7 while the Nifty Private Bank index PE was 16.86 (Source: Flash Finance sector summary, 14 October 2026).
PSU banks remain the cheapest major sector on both absolute PE and relative to history. Nifty PSU Bank PE of 7.34 sits close to its recent low and well below the private bank multiple. State Bank of India traded at a PE of approximately 10.6 on 14 October 2026 with a market cap near Rs 8.8 lakh crore (Source: company data and market quotes, 14 October 2026).
Oil and gas follows at 10.31. The sector benefits from high dividend yields (3.38%) but faces pressure from elevated crude prices and refining margins. Metal trades at 15.86 after a strong 1-year gain of 18.7%. The low PE reflects strong recent earnings rather than pure undervaluation.
On the expensive side, consumer durables at 58.64 and healthcare at 41.30 stand out. These multiples price in steady demand and limited cyclicality. Pharma at 40.34 has delivered a 16.8% 1-year return, supporting the higher multiple through earnings growth.
IT at 18.51 looks inexpensive versus its own history. The index is down 14.3% over one year, and the PE sits below the Nifty 50. Investors who remember the 2022-2023 correction in IT know that low PE alone does not guarantee a quick rebound if growth slows.
Sector PE is a starting filter, not a final decision tool. Once you identify a cheap or reasonably valued sector, move to individual company analysis. Look at debt levels, return on equity, order book visibility and free cash flow.
Capital goods is a useful example. The sector has traded at elevated multiples for several years because of government capex and private investment. BSE Capital Goods index PE was reported around 49-50 in mid-October 2026. Large names such as Larsen & Toubro and Bharat Electronics carry PEs in the 27-45 range depending on the exact date and source. You can review the full list of capital goods companies and their current ratios on the capital goods stocks page.
A practical approach is:
Many investors made the mistake in 2021 of buying high-PE growth sectors without checking whether earnings could support the multiple. When growth slowed, the stocks corrected sharply. The opposite error is buying a low-PE cyclical sector right at the peak of the commodity cycle.
Research Stocks Smarter with Dhanarthi AI Screener
Analyze 5,000+ NSE & BSE stocks with 150+ custom filters, real-time volume breakout scans, and transparent fundamental data.
Use Dhanarthi Screener
Financial services is one of the largest weights in the Nifty. Nifty Financial Services PE stood at 15.00 and Nifty Financial Services Ex-Bank at 20.20 on 14 October 2026. The broader financial services median PE was around 19.7.
Banks dominate the calculation. HDFC Bank traded near a PE of 14-15 in mid-October 2026 with a market capitalisation above Rs 10.9 lakh crore (Source: market data, 14 October 2026). Private banks as a group trade higher than PSU banks because of better return ratios and lower credit costs in recent years.
NBFCs and insurance companies pull the ex-bank index higher. These businesses often carry higher PEs because of growth expectations or different accounting. You can explore individual financial services names and filter them by PE, net interest margin and asset quality on the financial services stocks page.
A common investor error is treating all financial stocks the same. A PSU bank at 8x PE and a high-growth NBFC at 25x PE serve different roles in a portfolio. The sector PE simply shows the weighted average.
PE ratio has clear limits when used across sectors.
Loss-making or low-profit companies distort the number. Defence and certain capital goods names can show very high PEs because of temporary low earnings or high growth expectations. Nifty Defence median PE appeared near 79 in one sector summary (Source: Flash Finance, 14 October 2026).
Accounting differences matter. Banks report net interest income differently from manufacturing companies. Commodity companies show large swings in inventory and mark-to-market gains. A single-year PE can mislead.
One-time items affect trailing earnings. A large exceptional gain or provision can make the current PE look artificially low or high. Always check the quality of the last four quarters.
Forward PE (based on expected earnings) is often more useful than trailing PE, especially in cyclicals. Most free data sources publish trailing numbers, so investors must estimate the next year’s earnings themselves or use broker reports.
Sector valuations have widened in 2026. IT, banks and realty have traded at discounts to their long-term averages while healthcare and defence have held premiums (Source: market commentary citing forward PE gaps). This split reflects different earnings outlooks and foreign investor flows.
In past cycles, the cheapest sectors often stayed cheap for longer than expected when growth disappointed. PSU banks remained at single-digit PEs for years after the NPA cycle. IT traded at high teens to low twenties for long periods before the 2020-2021 re-rating.
A useful habit is to note the sector PE every quarter alongside the Nifty PE. Over time you build a personal sense of normal ranges. When a sector moves more than 20-25% away from its own average, it deserves a closer look, either as a potential opportunity or as a warning.

Confused about chart patterns & stock analysis?
Use
Dhanarthi Stock Guru
to chat, analyze price patterns, and ask questions directly.
Sector wise PE ratio India gives a quick map of where the market is pricing different industries. As of 14 October 2026, PSU banks and oil and gas sit at the low end while consumer durables, healthcare and pharma sit at the high end. The Nifty 50 PE of 19.4 sits in the middle.
Use the numbers as a filter. Then study individual companies, their balance sheets and the reasons behind the current multiple. Low PE is not the same as good value, and high PE is not the same as expensive if earnings are rising fast. Combine sector data with company-level research before you decide.
This article is for educational purposes only. It does not constitute investment advice. Please consult a SEBI-registered financial advisor before making investment decisions.
1. What is the current sector wise PE ratio in India?
As of 14 October 2026, Nifty PSU Bank PE is 7.34, Nifty Oil & Gas is 10.31, Nifty IT is 18.51, Nifty Pharma is 40.34 and Nifty Consumer Durables is 58.64. Nifty 50 PE is 19.41. These are trailing twelve-month index PEs.
2. Which sector has the lowest PE ratio in India right now?
Nifty PSU Bank has the lowest major sector PE at 7.34. Individual PSU banks such as State Bank of India trade around 10-11 times earnings. Oil and gas is the next lowest at 10.31.
3. Is a low sector PE always a good sign to buy?
No. A low PE can mean the market expects earnings to fall or that the sector carries higher risk. Check the reason for the low multiple, the quality of recent earnings and the sector’s own historical average before deciding.
4. How does sector PE differ from individual stock PE?
Sector PE is a weighted or median figure for many companies. Large stocks dominate index PE. A sector can look cheap while some companies inside it trade at high multiples and others at very low ones. Always look at both levels.
5. Where can I find updated sector wise PE ratio data?
NSE publishes official sectoral index data. Several market data sites compile the PE, PB and dividend yield of these indices daily. Cross-check at least two sources and note the exact date because numbers change with every trading session.
Share Market
IPO
Artificial Intelligence
Semi Conductor