





Best Small Cap Stocks in India 2026
October 13, 2026



TABLE OF CONTENTS
Get AI Summary






Best small cap stocks in India are shares of companies ranked 251st and below by market capitalisation on the NSE. These stocks sit in the Nifty Smallcap 250 index, which closed at 17,772.80 on 12 October 2026 with a PE of about 34. Small caps offer higher growth potential than large caps but carry more volatility and liquidity risk. Investors typically allocate a limited portion of their portfolio here after checking ROE, debt levels and earnings consistency. Data in this article comes from NSE, BSE filings and Screener.in as of mid-October 2026.
Small cap stocks represent companies with market capitalisation ranks from 251 onwards in the Nifty 500 universe. SEBI and NSE use full market capitalisation to classify large, mid and small caps. The Nifty Smallcap 250 tracks the top 250 of these smaller companies. As of 12 October 2026 the index stood at 17,772.80, up 1.13% for the day, with a PE ratio near 34 and a 1-year return of roughly 3.9%.
These companies are often in growing niches such as electronics manufacturing, specialty chemicals, auto components or defence. Their earnings can expand faster from a smaller base, but share prices swing more sharply. Average daily trading volumes are lower than in large caps, so large orders can move prices. Most retail investors keep small cap exposure between 10% and 20% of equity allocation and review holdings every quarter. Explore broader sector data on the sectors page for context across industries.
Understanding the difference between large, mid and small caps helps set expectations. Read our guide on large cap vs mid cap vs small cap for a clear comparison of risk and return profiles.
Research Stocks Smarter with Dhanarthi AI Screener
Analyze 5,000+ NSE & BSE stocks with 150+ custom filters, real-time volume breakout scans, and transparent fundamental data.
Use Dhanarthi Screener
After a weak 2025, several small caps rebounded in calendar 2026. The Economic Times reported that some names which fell more than 40% in 2025 more than doubled in 2026 so far. FIIs have increased stakes in select low-debt small caps. Nifty Smallcap 250 PE of 34 sits near the high end of its five-year range, so valuation remains a filter.
Strong earnings growth in electronics, specialty chemicals and auto ancillaries has supported stock-specific gains. Companies with rising order books, export exposure and controlled debt have attracted both domestic and foreign buying. Historical cycles show small caps can deliver outsized returns after corrections, but only when business fundamentals stay intact.
Common investor mistakes include buying purely on price momentum or ignoring high debt. In past cycles, small caps that lacked earnings support corrected sharply once institutional buying slowed. Quality filters such as ROE consistency and low leverage have historically protected capital better than pure growth stories.
We looked at market capitalisation around ₹20,000–40,000 crore, recent earnings growth, ROE above 10–15%, debt-to-equity below 0.5 and positive 6-month or 1-year price action where available. All figures come from public filings and Screener.in data as of 12 October 2026. This is not a buy recommendation. Past returns do not guarantee future results.
Selection also considered sector exposure to structural themes such as electronics manufacturing, battery materials, copper mining and commercial vehicles. Companies with improving margins or large order books received preference. Liquidity was checked through average trading volumes reported on NSE.
The table below summarises key metrics for five names frequently discussed in the small cap space.
| Company | Market Cap (₹ Cr) | PE (TTM) | ROE (%) | Debt/Equity | Notes |
|---|---|---|---|---|---|
| Syrma SGS Technology | 33,495 | 90.2 | 14.0 | 0.13 | EMS player, strong revenue growth |
| HFCL | ~39,800 | 67.8 | — | — | Telecom & defence order book |
| Himadri Speciality Chemical | 33,398 | 41.8 | 17.8 | Low | Specialty chemicals, battery materials |
| Hindustan Copper | 45,440 | 37.6 | 32.9 | Low | Only listed copper miner |
| Force Motors | ~22,413 | 17.9 | 29.9 | Low | Strong FY26 rally, low debt |
Data sourced from Screener.in, company filings and NSE. Last updated: October 2026.
Syrma SGS Technology is an electronics manufacturing services company. As of 12 October 2026 its market capitalisation stood at ₹33,495 crore with a PE of 90.2 and ROE of 14%. Trailing twelve-month revenue reached about ₹5,464 crore. The company reported strong Q3 FY26 numbers with sales up 45% year-on-year to ₹1,274 crore and PAT up 108% to ₹110 crore. Exports form a meaningful part of growth. Debt-to-equity remains low at around 0.13. High PE reflects growth expectations, so investors watch execution on capacity additions.
Syrma serves automotive, industrial and consumer electronics customers. Management has guided for continued revenue growth in the high 20s to 30% range. Capacity expansions in PCB and related areas are underway. The stock has delivered strong multi-year returns, but the elevated PE means any slowdown in order inflow can pressure the price. Review the latest quarterly filing on BSE before considering exposure.
HFCL operates in telecom equipment and has expanded into defence. Market capitalisation was around ₹39,800 crore in mid-October 2026. FY26 consolidated revenue reached ₹4,949 crore, up 21.77% year-on-year. The order book stood near ₹21,206 crore at one point. Export revenue contributed about 41% of total. The stock has shown strong 6-month returns in some screeners. Investors track defence order inflows and optical fibre demand.
HFCL has moved from traditional telecom cables toward higher-value products and defence electronics. Optical fibre capacity expansion continues. The company reports improving margins in recent quarters. Debt levels need monitoring because capital expenditure remains elevated. Government and private telecom capex cycles influence near-term visibility.
Himadri Speciality Chemical focuses on carbon materials and specialty chemicals, including anode and cathode materials for batteries. Market capitalisation was ₹33,398 crore with PE of 41.8 and ROE of 17.8% as of 12 October 2026. FY26 consolidated revenue was ₹4,661 crore and EBITDA ₹1,006 crore. The company has commissioned anode material capacity and targets larger LFP cathode volumes. ROCE stood near 22%. Balance sheet remains relatively clean.
Himadri holds leadership in coal tar pitch and naphthalene in India. Entry into lithium-ion battery materials provides a longer-term growth avenue. R&D strength with over 180 scientists supports product development. Commodity price fluctuations in carbon black and related products affect quarterly margins. The stock has delivered strong five-year returns according to public data.
Hindustan Copper is India’s primary listed copper mining company. Market capitalisation reached about ₹45,440 crore with PE of 37.6 and ROE of 32.9% on 12 October 2026. FY26 consolidated PAT was roughly ₹921 crore. The stock has rallied more than 160% in FY26 so far according to Economic Times reports, partly on copper price strength and FII interest. Debt remains low. Copper demand from grids and EVs supports the long-term story, but commodity prices drive near-term earnings.
The company is a government-controlled enterprise with integrated mining to finished copper products. Global copper prices and domestic demand from power and infrastructure sectors are the main earnings drivers. FII holdings have risen in recent quarters. Production volumes and realisation prices should be tracked in each quarterly update.
Force Motors manufactures commercial vehicles and engines. Market capitalisation was around ₹22,413 crore with PE near 17.9 and ROE of 29.9% in recent data. The stock rose sharply in FY26. The company is largely debt-free. Investors watch volume recovery in its segments and export opportunities. Lower PE compared with some growth small caps makes the valuation look more moderate.
Force Motors supplies engines and vehicles to niche commercial segments. Strong return ratios and a clean balance sheet stand out in the small cap universe. Volume growth and margin expansion have supported the share price rally. Auto ancillary and commercial vehicle demand cycles influence results. Compare latest sales numbers with industry peers before adding.
Electronics manufacturing services benefit from China-plus-one shifts and domestic production-linked incentives. Specialty chemical companies with battery material exposure ride the energy storage theme. Copper miners gain from electrification demand. Auto component and commercial vehicle makers see recovery as interest rates and consumer demand stabilise. These themes do not protect every company; only those with execution track records and balance sheet strength tend to sustain gains.
Small caps can fall 30–50% in a single year during risk-off periods, as seen in parts of 2025. Liquidity dries up quickly, widening bid-ask spreads. Governance and disclosure quality vary more than in large caps. Earnings estimates miss more often because fewer analysts cover these companies. High PE stocks are especially sensitive to growth disappointments. Allocation size and regular review reduce the chance of permanent capital loss.
In 2024–2025 many small caps corrected sharply after multi-year rallies. Investors who bought at peak valuations without checking debt or cash flow faced large drawdowns. Checking pledged shares and related-party transactions remains important. Use the latest annual report and quarterly results rather than relying only on price charts.
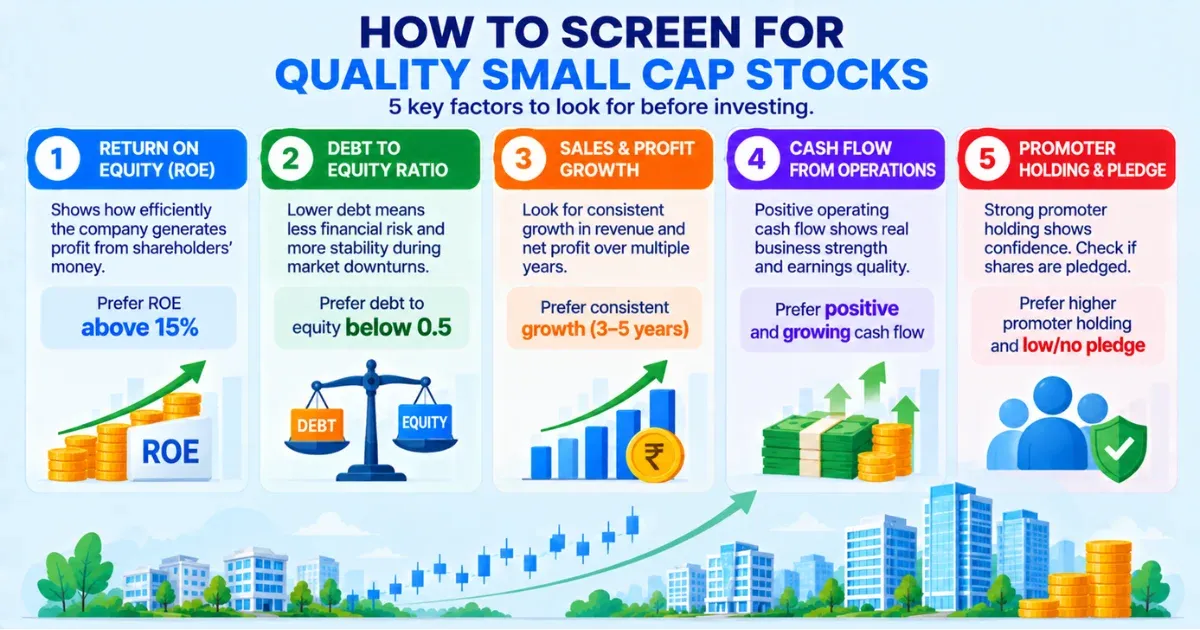
Use ROE above 15%, debt-to-equity under 0.5, consistent sales and profit growth over three years, and positive free cash flow. Check promoter holding and pledged shares. Compare any shortlist with sector averages and recent concall commentary.
Investors seeking income can also look at best dividend paying stocks in India. Dividend yield is usually lower in pure growth small caps, so balance the portfolio accordingly.
Screen for positive operating cash flow in at least three of the last five years. Avoid companies where profit growth comes only from one-time gains. Cross-check management commentary in concalls for order book updates and margin guidance. Update the screen after every results season because rankings change quickly in the small cap segment.
A simple approach is to keep large caps as the core, mid caps for moderate growth and small caps for a satellite 10–15% allocation. Rebalance when small caps outperform for two consecutive years. Avoid putting more than 2–3% of total equity in any single small cap name. Past cycles show that patient investors who buy after corrections and hold quality businesses through volatility have fared better than those chasing momentum.

Confused about chart patterns & stock analysis?
Use
Dhanarthi Stock Guru
to chat, analyze price patterns, and ask questions directly.
Best small cap stocks in India in 2026 include names such as Syrma SGS Technology, HFCL, Himadri Speciality Chemical, Hindustan Copper and Force Motors. Each shows solid recent financial numbers, manageable debt and exposure to structural themes. The Nifty Smallcap 250 PE near 34 reminds investors to stay selective. Always cross-check the latest quarterly results and balance sheet before adding any stock.
This article is for educational purposes only. It does not constitute investment advice. Please consult a SEBI-registered financial advisor before making investment decisions.
1. What are the best small cap stocks in India right now?
Names such as Syrma SGS Technology, HFCL, Himadri Speciality Chemical and Hindustan Copper appear frequently because of recent earnings growth and order visibility. Always verify latest PE, ROE and debt figures yourself.
2. Are small cap stocks riskier than large cap stocks?
Yes. Small caps show higher volatility, lower liquidity and wider earnings swings. A 40% drawdown is common in weak markets. Limit allocation and review holdings regularly.
3. What is the current PE of the Nifty Smallcap 250?
As of 12 October 2026 the Nifty Smallcap 250 PE was around 34. This sits near the upper end of its five-year range.
4. How much of my portfolio should be in small caps?
Most advisors suggest 10–20% of equity allocation for investors who can tolerate volatility. Beginners often start lower until they understand the risks.
5. Where can I find latest data on small cap stocks?
Check NSE, BSE filings, Screener.in and company investor presentations. Update figures after every quarterly result.
Share Market
IPO
Artificial Intelligence
Semi Conductor