

10 Best Stock Analysis Websites in India for Beginner Traders
July 20, 2026




TABLE OF CONTENTS
Get an AI Summary of This Post Using The Tools Below.





Best stock analysis websites in India for beginners in 2026 include Screener.in and Dhanarthi's AI stock screener for fundamentals, Moneycontrol for news and research breadth, and TradingView for charting. The choice depends on whether you need stock screening, in-depth research, or technical charts.
Best overall for beginners: Screener.in for fundamental depth, paired with Dhanarthi's AI stock screener for faster filtering
Best for market news and data breadth: Moneycontrol
Best for technical charting: TradingView
Best free official data: NSE India and BSE India
Best for SEBI-registered research reports: Trade Brains Portal
A stock analysis website gives you the information required to research the company before investing: financial reports, ratios, shareholding pattern, news, price history, etc. A stock screener is a specific tool available on some, if not most, such websites.
The screener allows you to narrow down the universe of stocks based on some simple criteria like P/E ratio, Return on Equity, market value, debt-equity ratio, etc., thus giving you more focused results than you would get searching the whole list. Most stock analysis websites, like Dhanarthi, have both a screener and an analysis tool that lets you go from a broad search to analyzing the stocks you found.
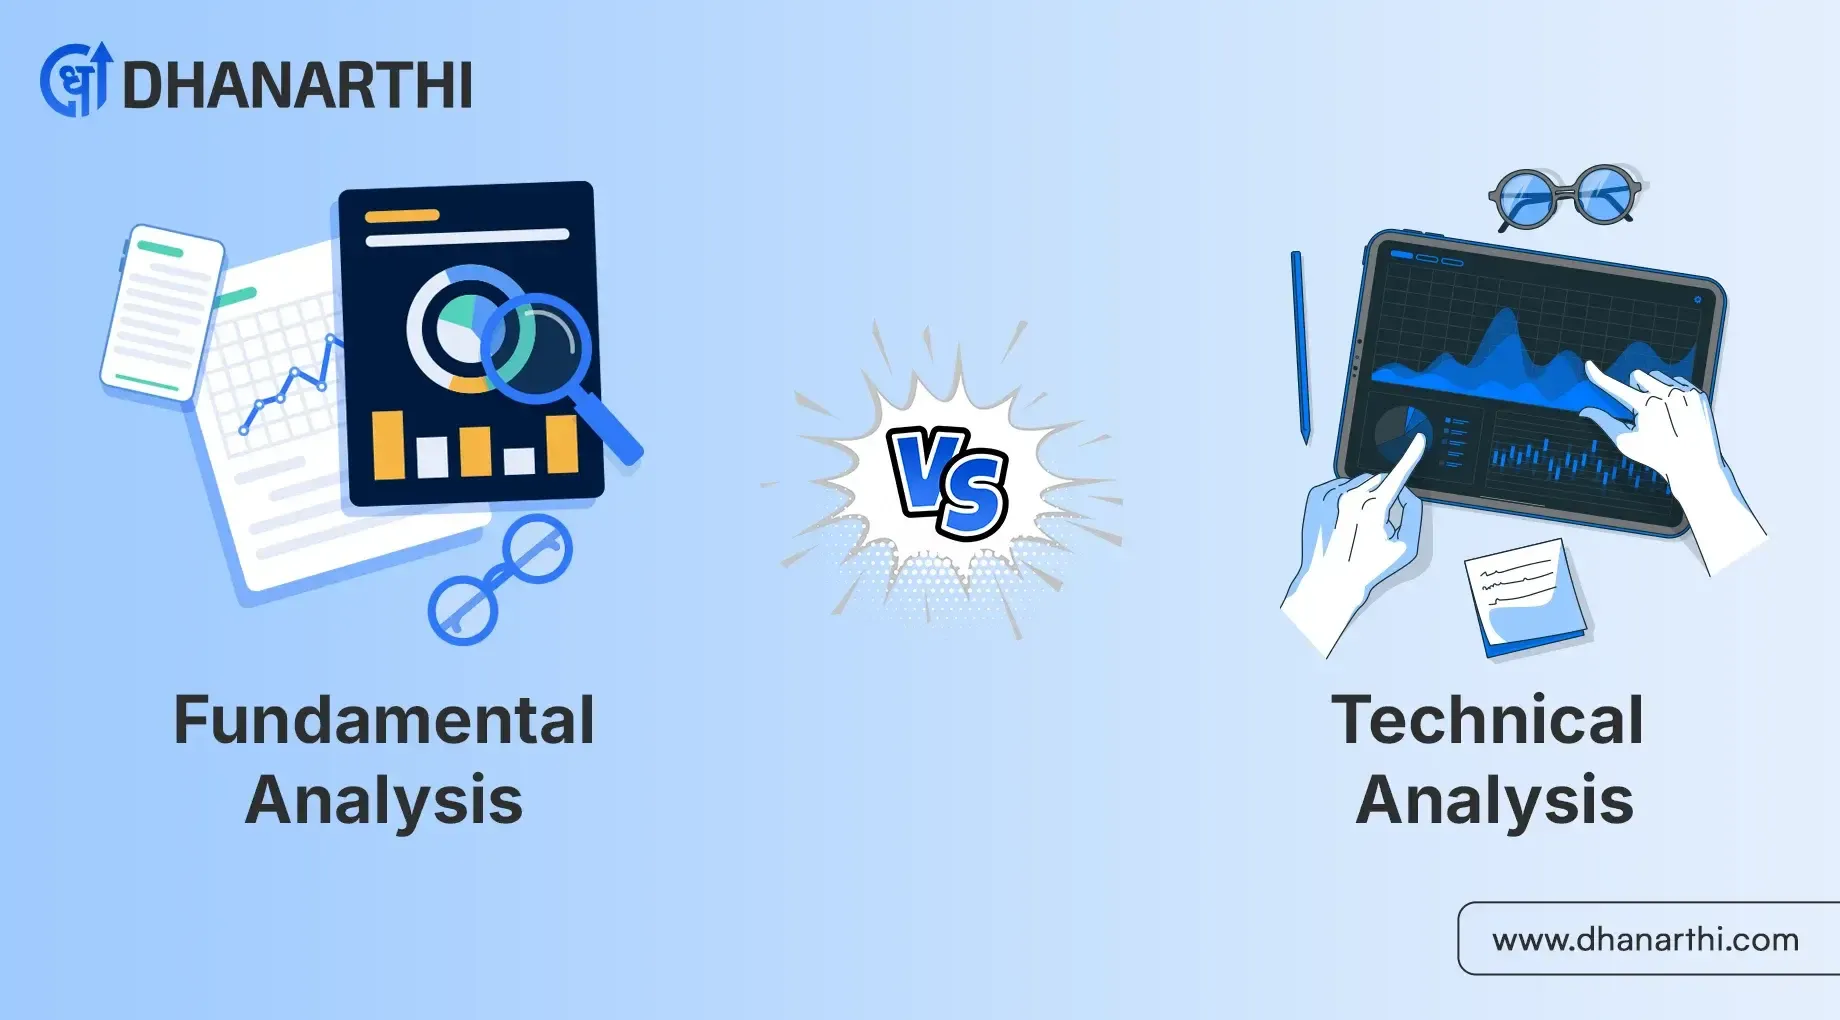
Fundamental analysis websites focus on such factors as a company’s revenue, profits, debt, and management. Technical analysis websites, on the other hand, examine price changes and volume, enabling one to time the purchase or sale of stocks. I would recommend that an investor begin with fundamental analysis and then move on to technical analysis.
Fundamental analysis websites study a company's financial health: revenue, profit, debt, and management quality. Technical analysis websites study price charts and volume to time entries and exits. Beginners should start with fundamentals to understand what they are buying, then add technical tools later for timing. For a full walkthrough of the process, see how to analyse a stock before investing.
| Your Goal | Best Type of Tool | Example Platform |
|---|---|---|
| Filter stocks by financial criteria | Stock screener | Dhanarthi, Screener.in |
| Study 10-year financial history | Fundamental data platform | Screener.in, Trade Brains Portal |
| Read market news and announcements | News-led portal | Moneycontrol |
| Time entries and exits with charts | Charting platform | TradingView |
| Get SEBI-registered analyst reports | Advisory-linked platform | Trade Brains Portal |
| Verify official company filings | Exchange website | NSE India, BSE India |
Data sourced from platform feature pages. Last updated: July 2026.
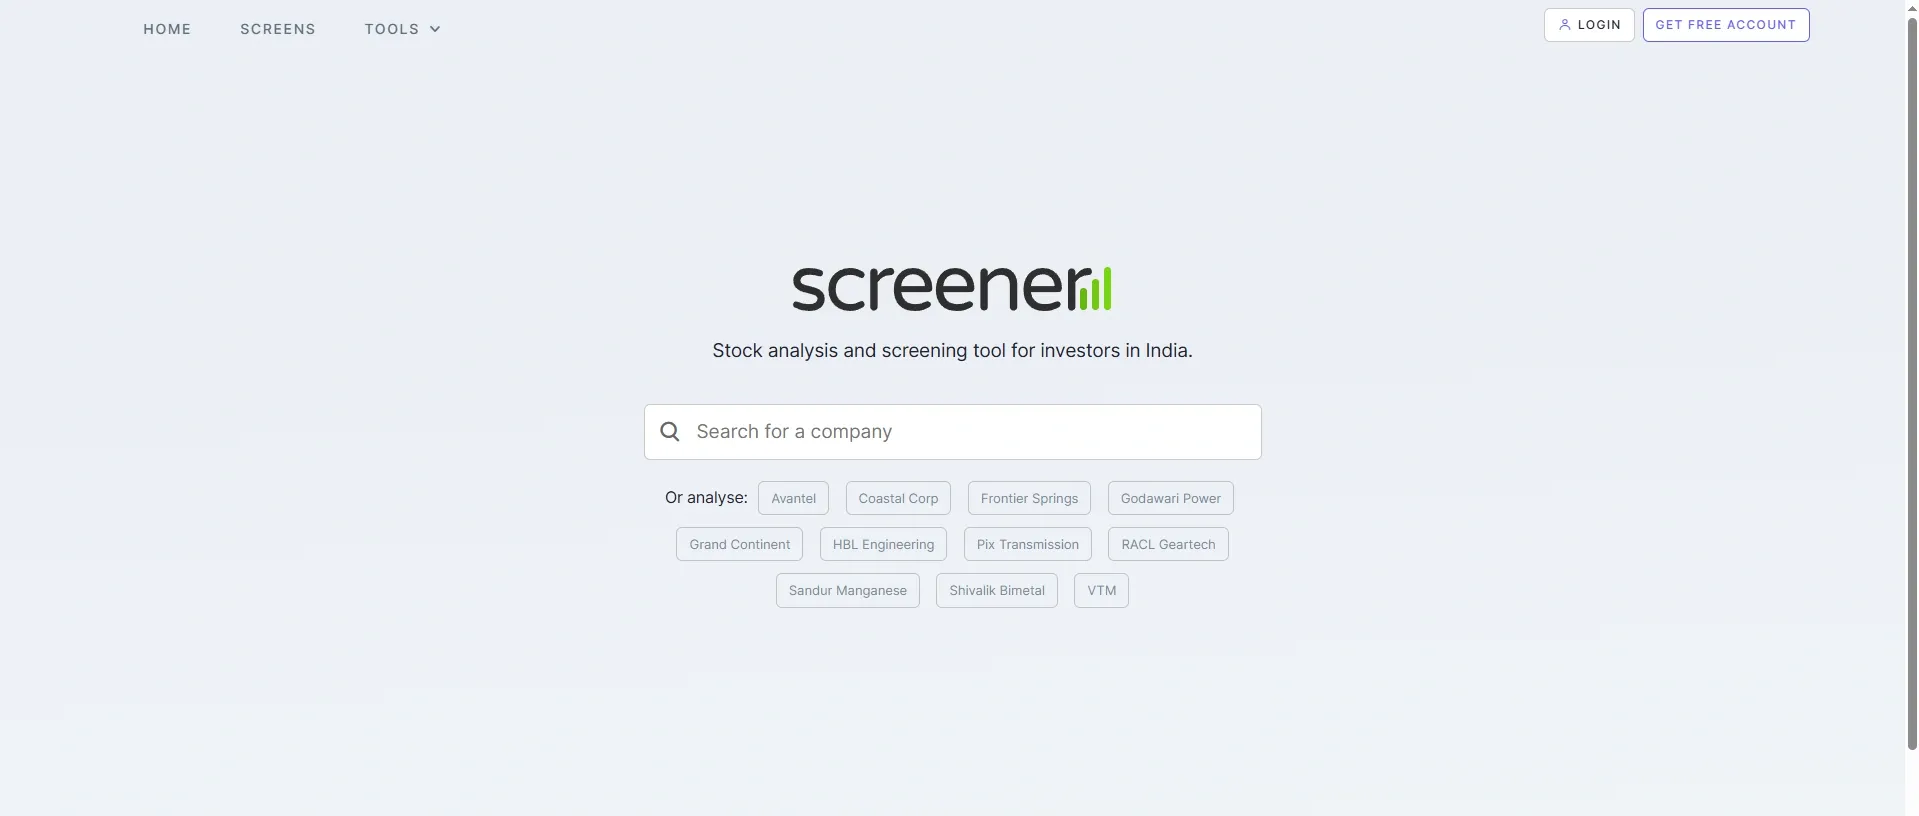
Screener. in is popular for its extensive fundamental research data, covering over ten years of financial history per company. An example of a basic screening involves seeking out stocks with the highest return on equity (ROE) and lowest debt. Using this screener, Tata Consultancy Services was among the companies that stood out with a ROE of 51.8% and a P/E ratio of 15.3 as of July 2026 (Source: Screener.in, TCS company page). The free plan offers sufficient options for most novice investors, while premium subscriptions enable one to export data and manage a watchlist.
Caveat: The interface is data-dense and takes time to get comfortable with for a first-time user.
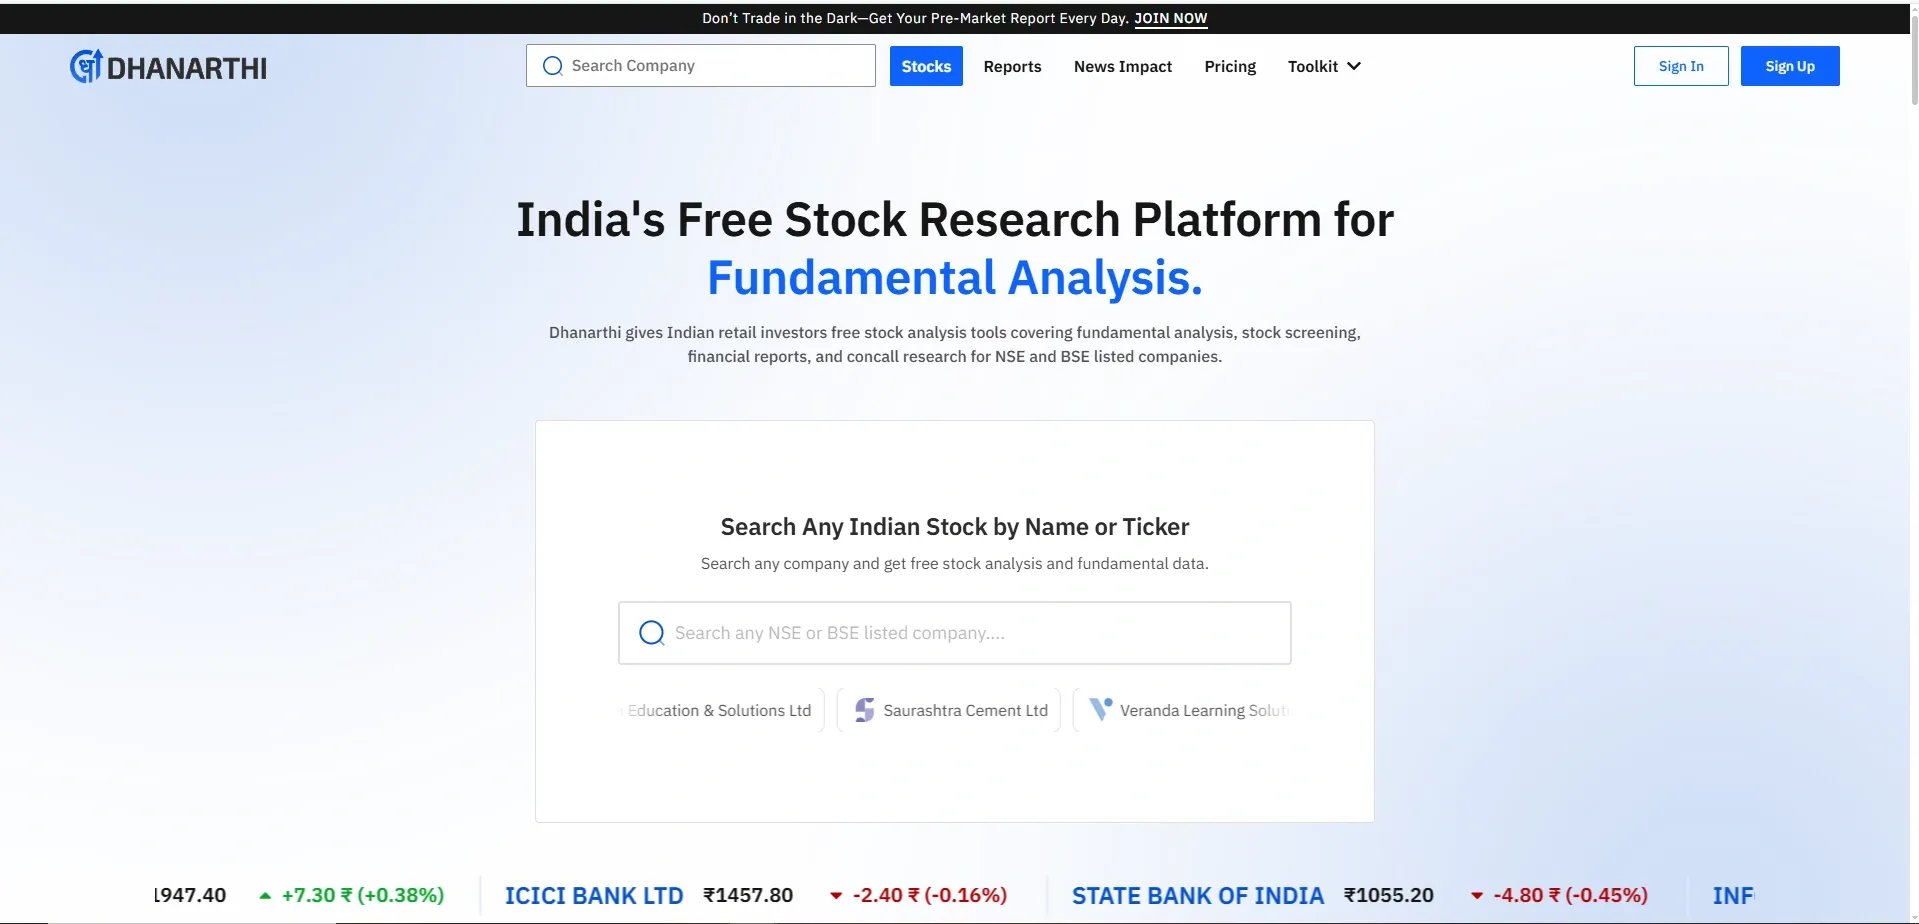
Dhanarthi is an AI-powered stock screener plus research assistant that understands financials in simple English - for India's retail investors who want fundamentals without getting a finance degree. It lets you filter stocks with confidence and understand why, demystifying complex concepts.
Caveat: As a newer entrant, its historical data depth is still growing compared to platforms with a decade of coverage.
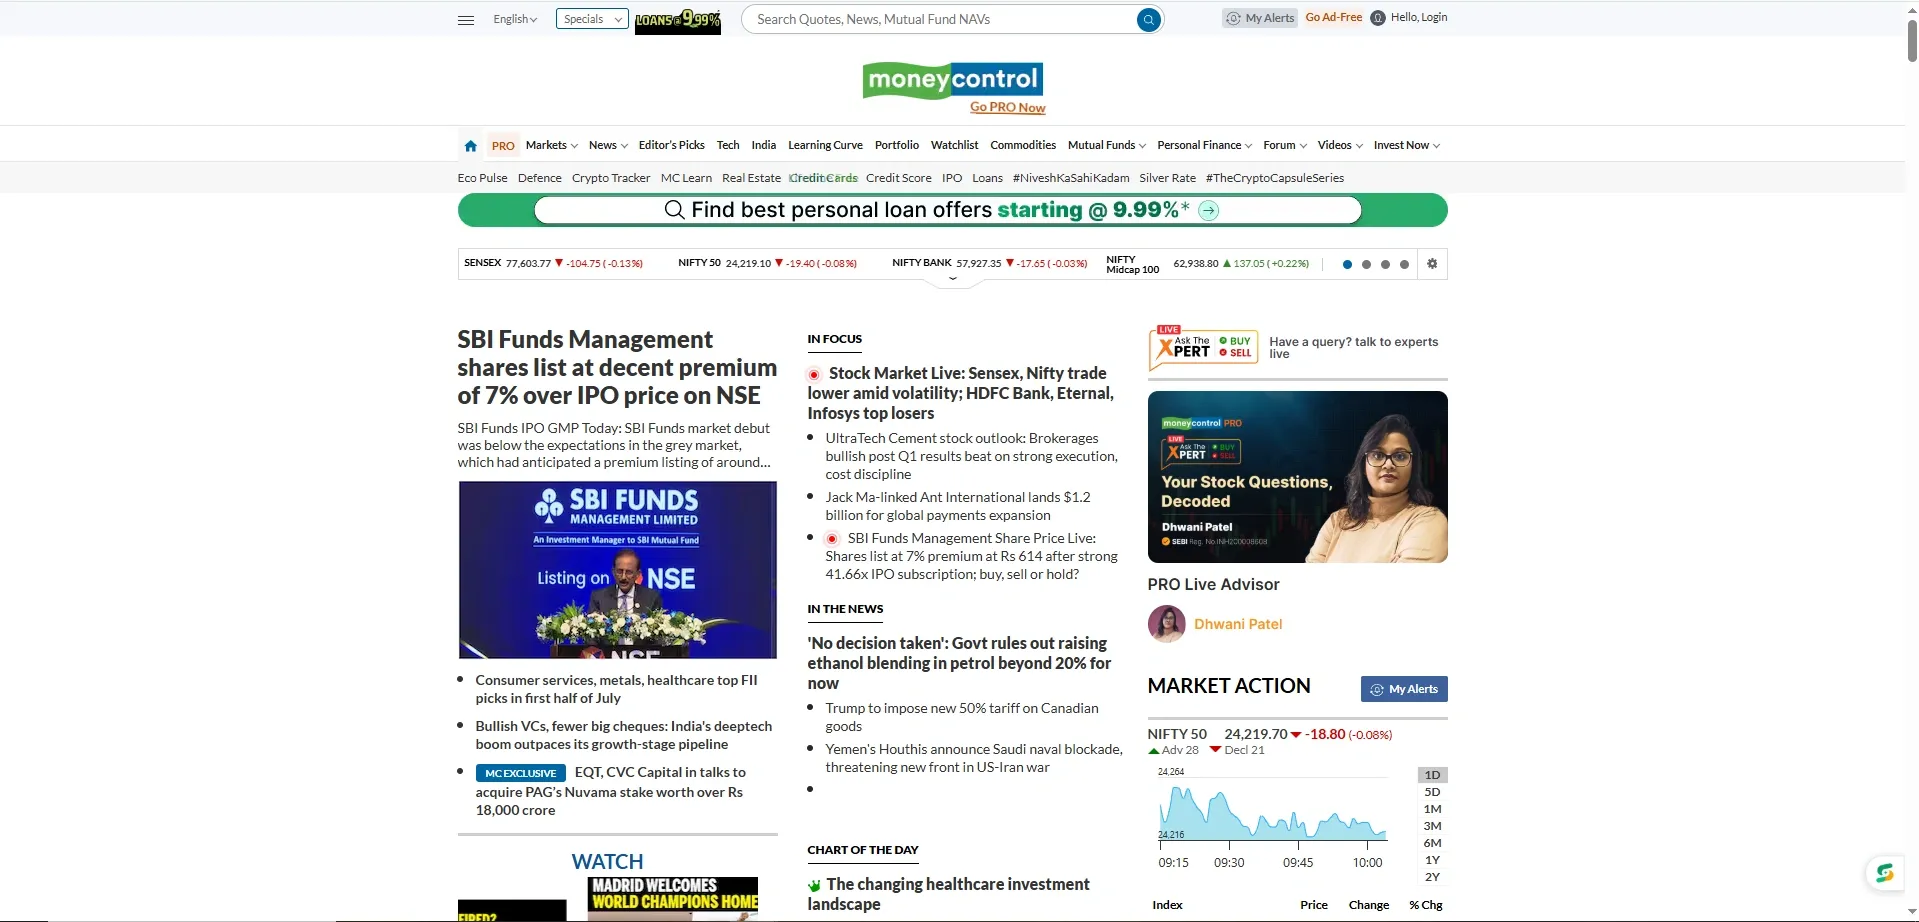
Moneycontrol covers company data, mutual funds, commodities, and currencies alongside continuous market news. Its breadth means most investors rarely need to leave the platform for updates.
Caveat: The sheer volume of content can overwhelm a first-time visitor looking for a simple answer.
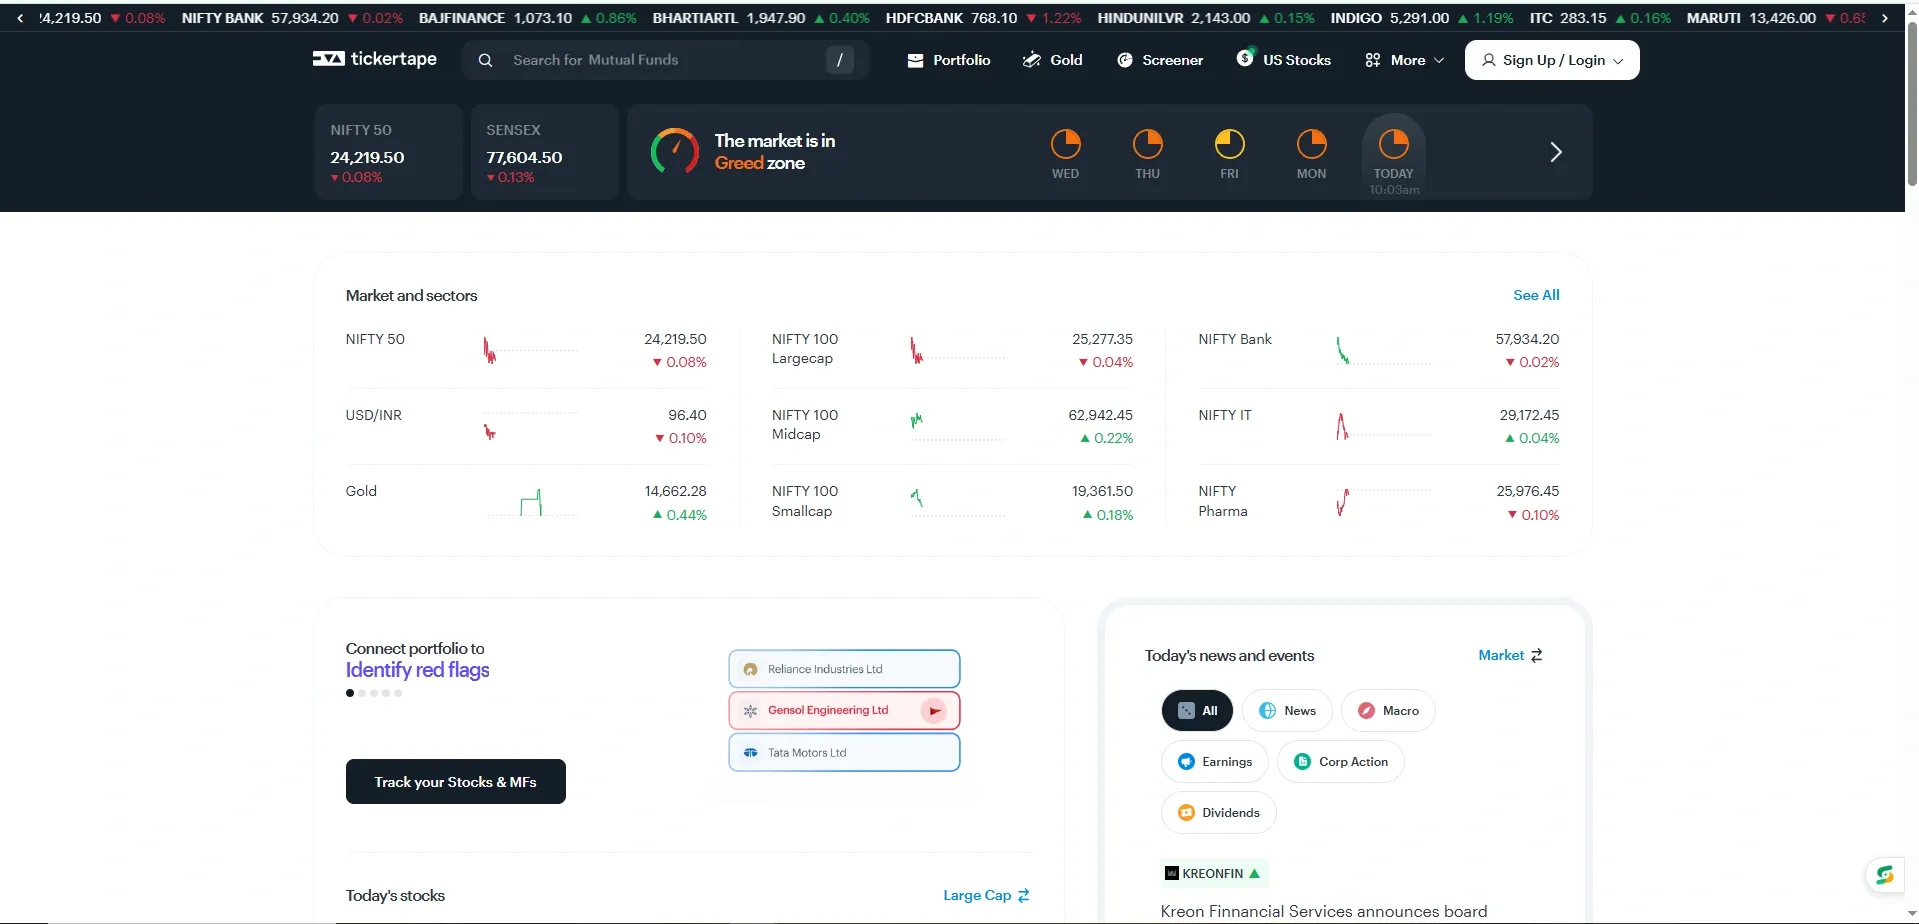
Tickertape presents valuation metrics and stock scorecards through clean visuals, making ratio-heavy data easier to read for someone new to fundamental analysis.
Caveat: Some advanced screening filters sit behind a paid plan.
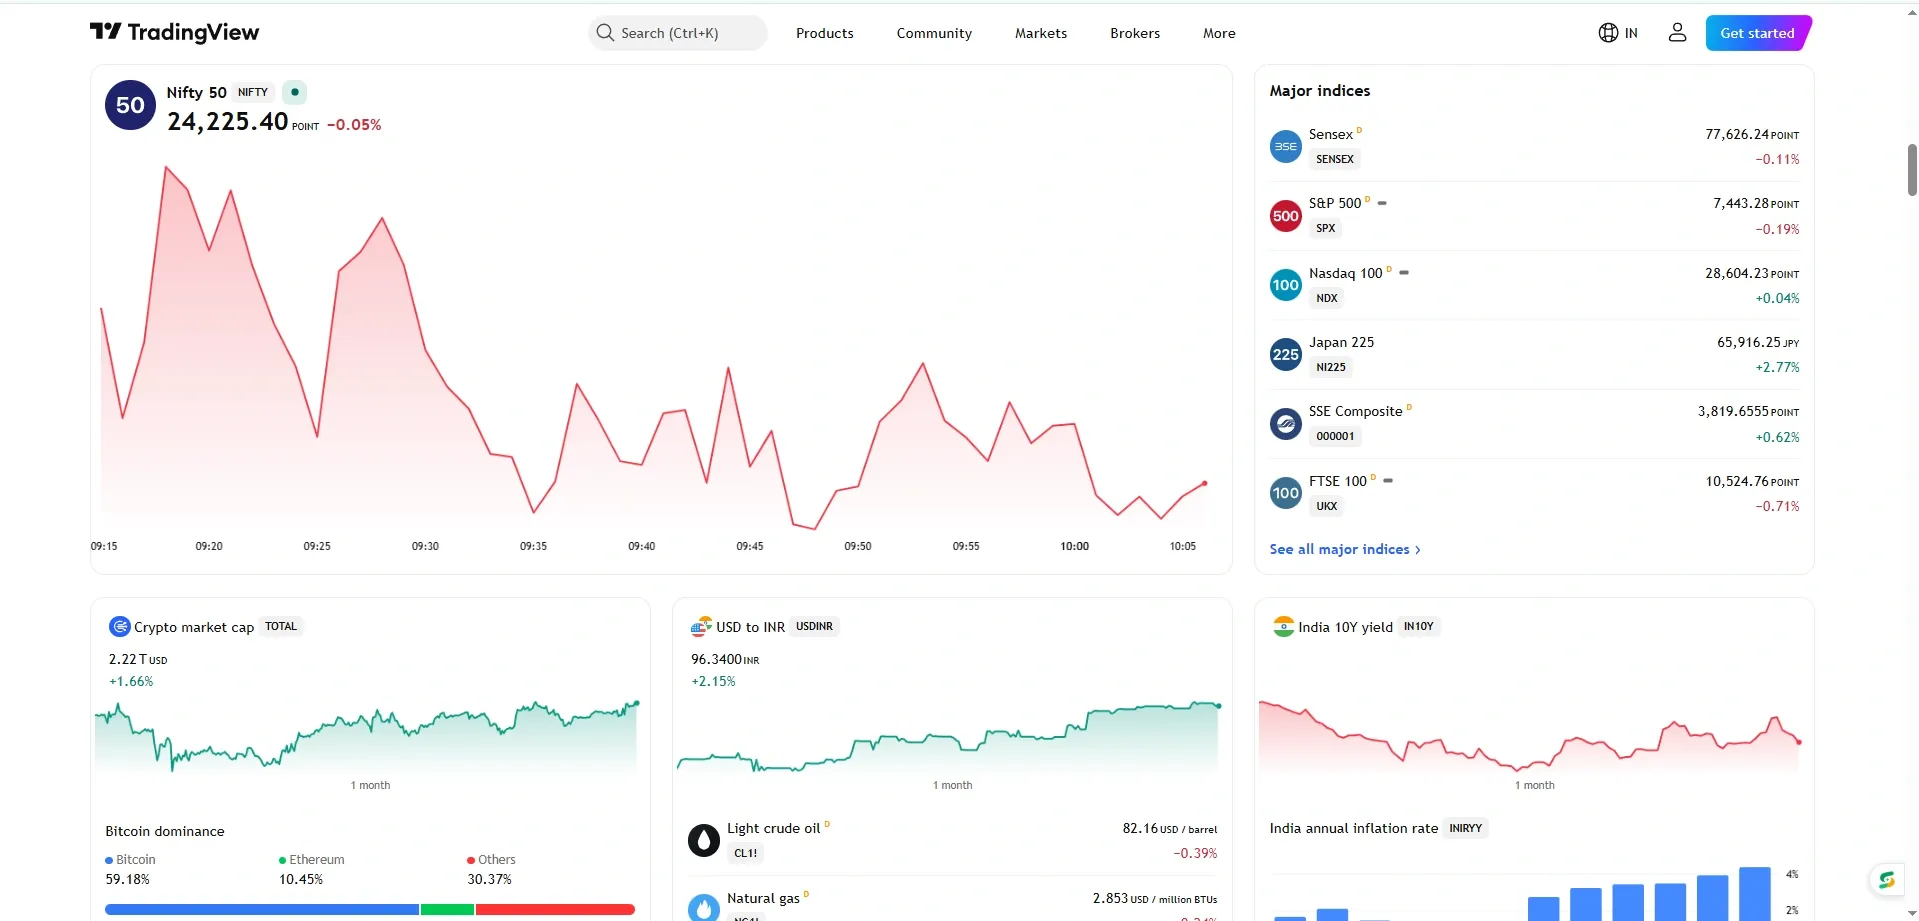
TradingView is a global leader for charting, with extensive Indian market data and hundreds of technical indicators. Its community feature lets traders study shared chart analysis from others.
Caveat: Built for technical analysis, so it is not a substitute for fundamental research.
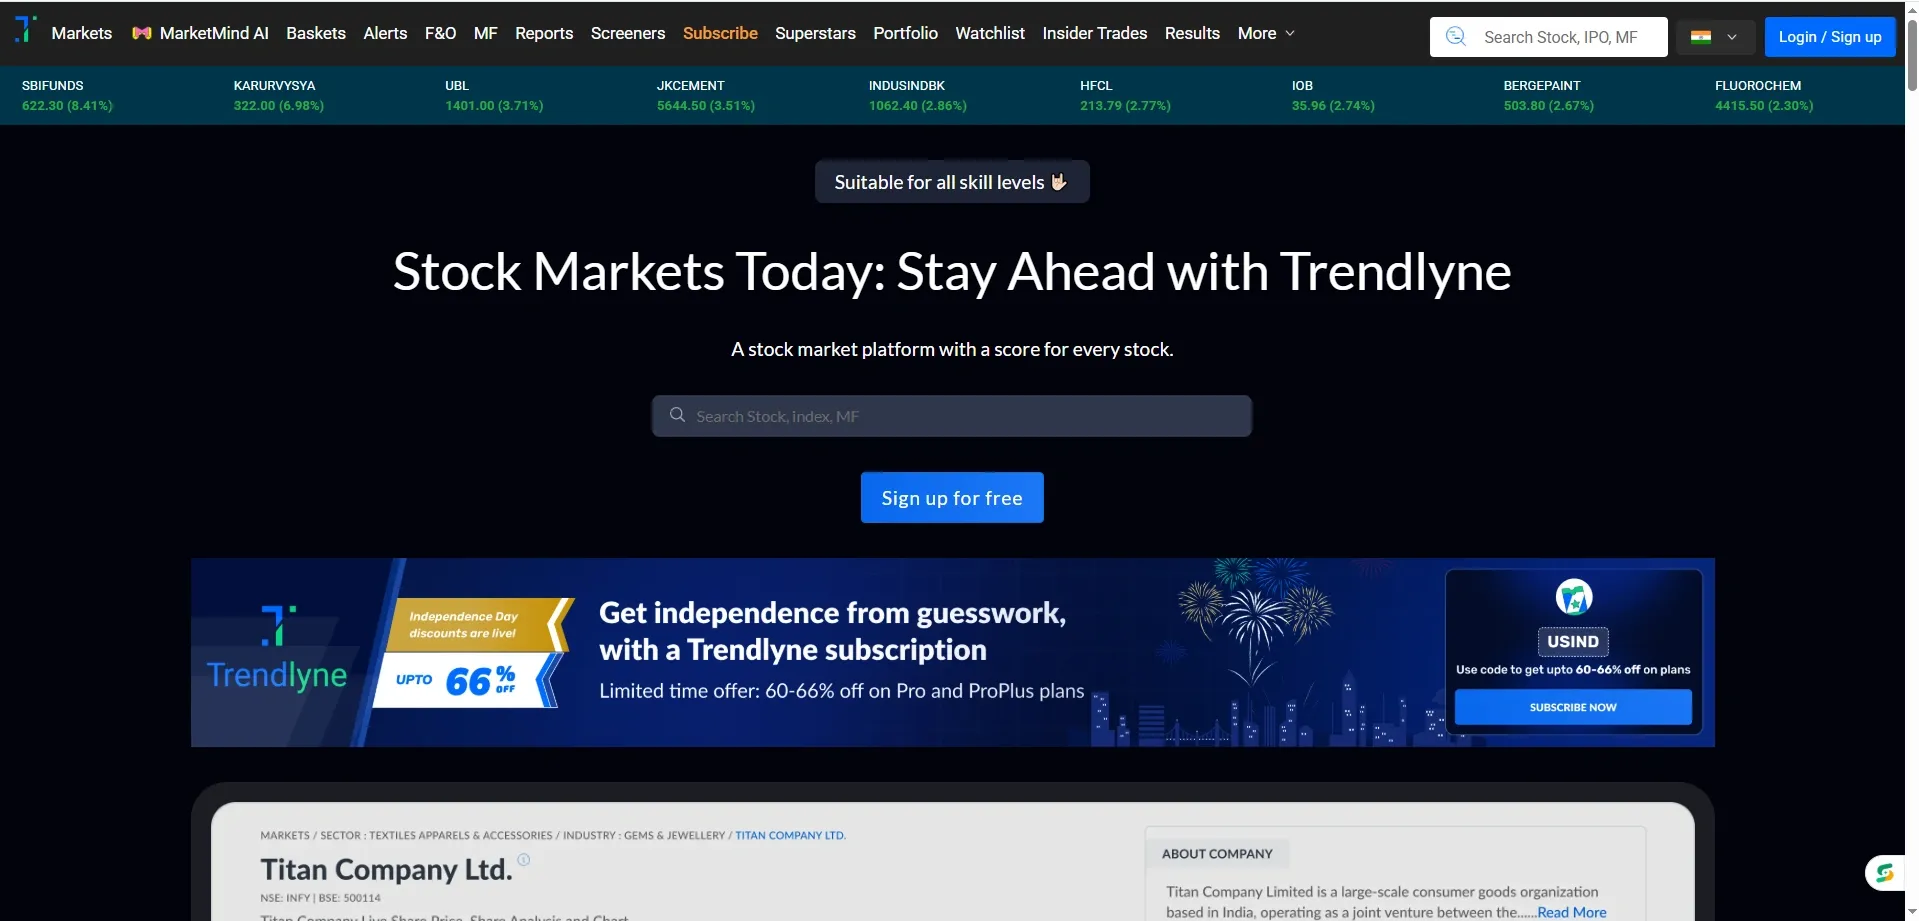
Trendlyne combines analyst estimates, SWOT-style breakdowns, and alerts for corporate actions like results and dividends in one dashboard.
Caveat: The depth of features can be more than a pure beginner needs at first.
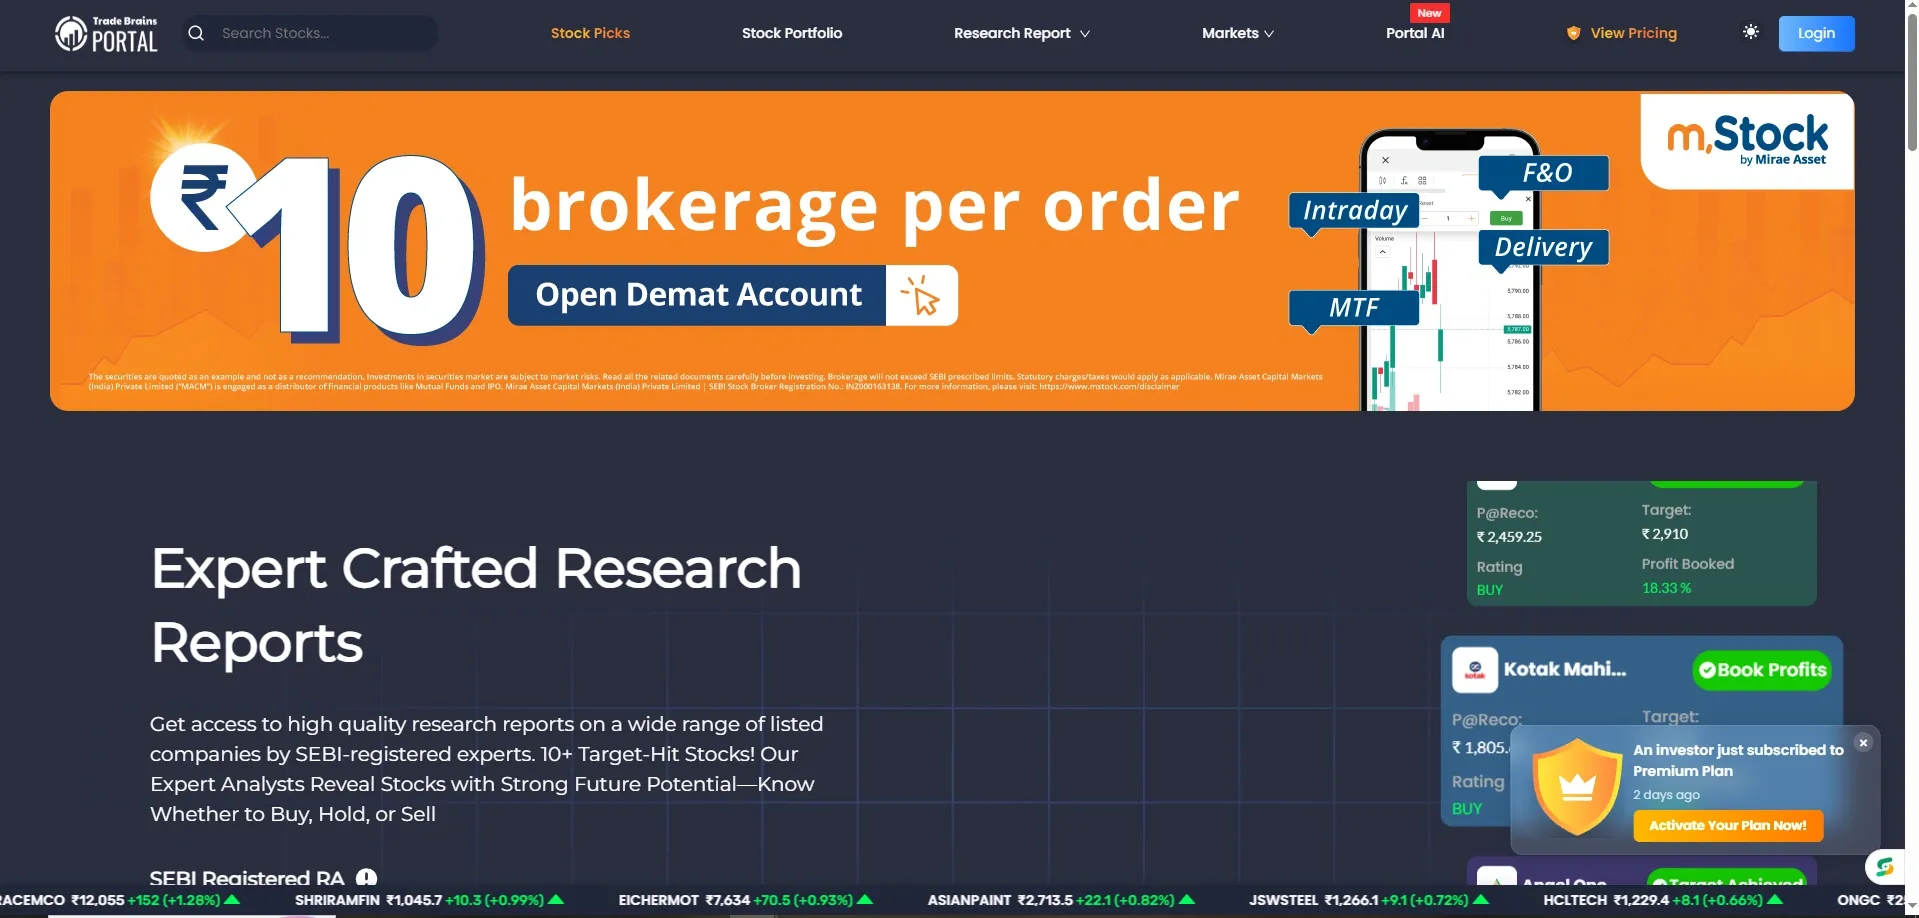
Trade Brains Portal provides equity research reports from SEBI-registered Research Analysts alongside standard fundamental data, useful for investors who want a professional opinion layered on top of raw numbers.
Caveat: Full report access sits behind subscription tiers.
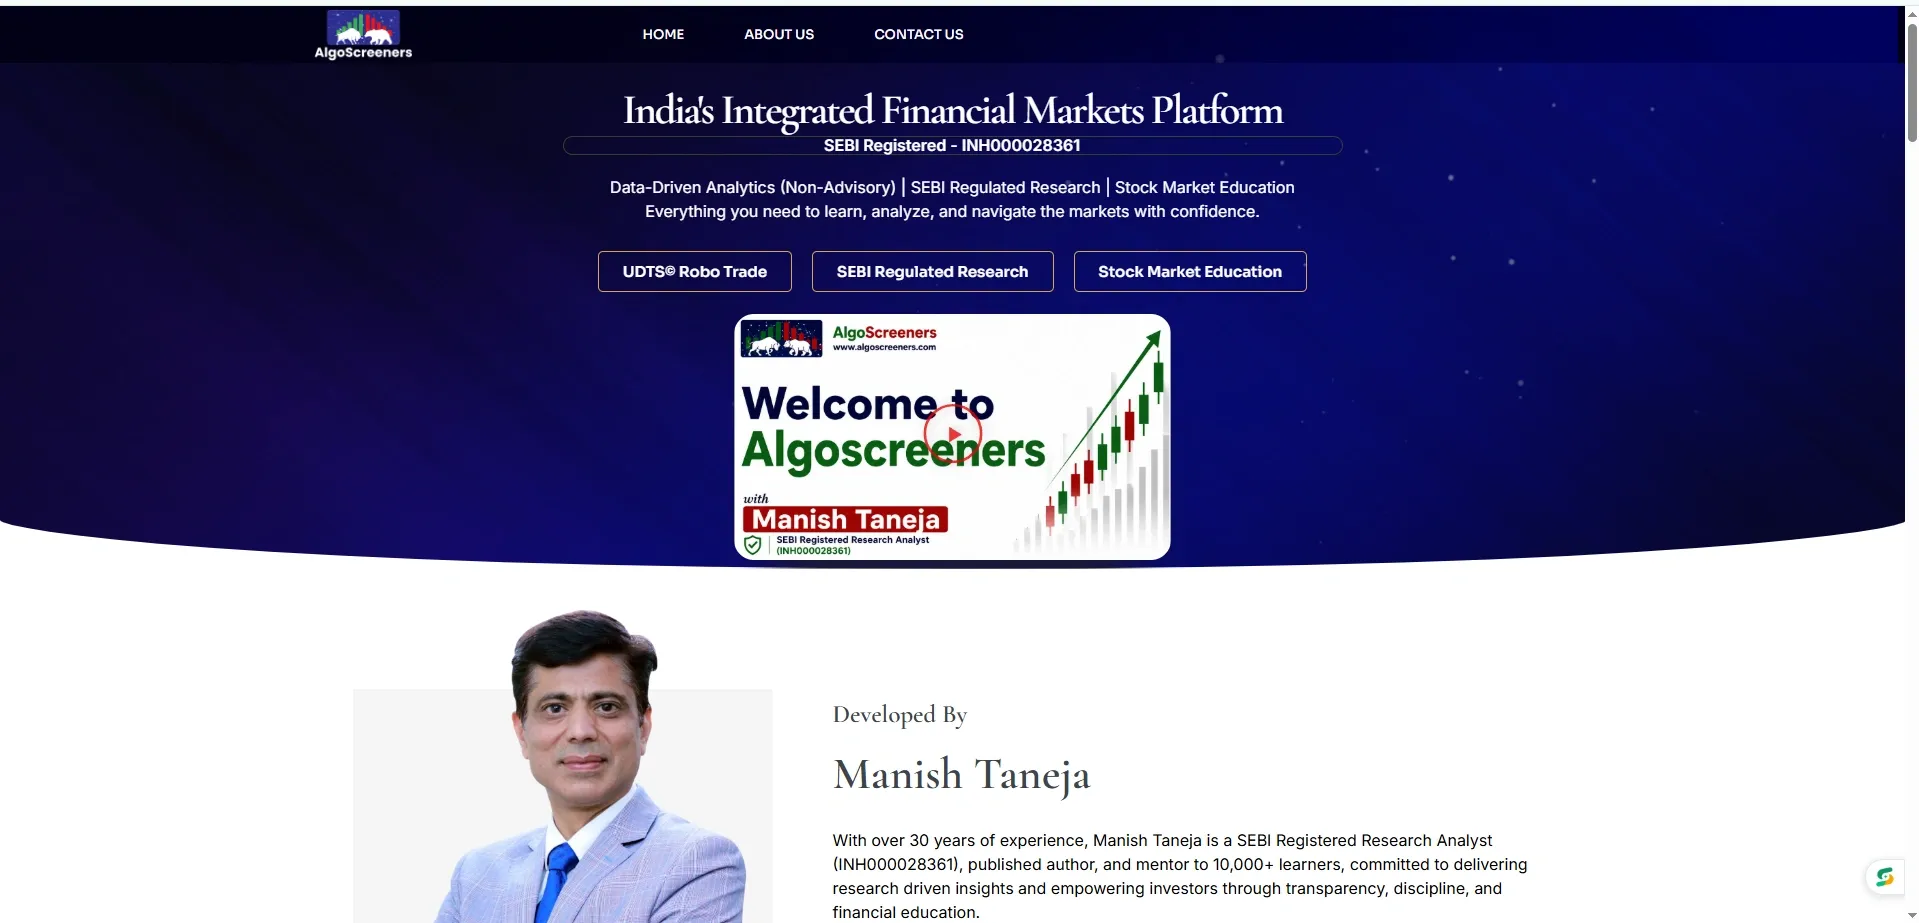
AlgoScreeners uses algorithmic filters combining technical indicators with fundamental parameters, aimed at traders who want a data-model-driven shortlist rather than manual screening.
Caveat: Better suited to traders already comfortable with technical terminology.
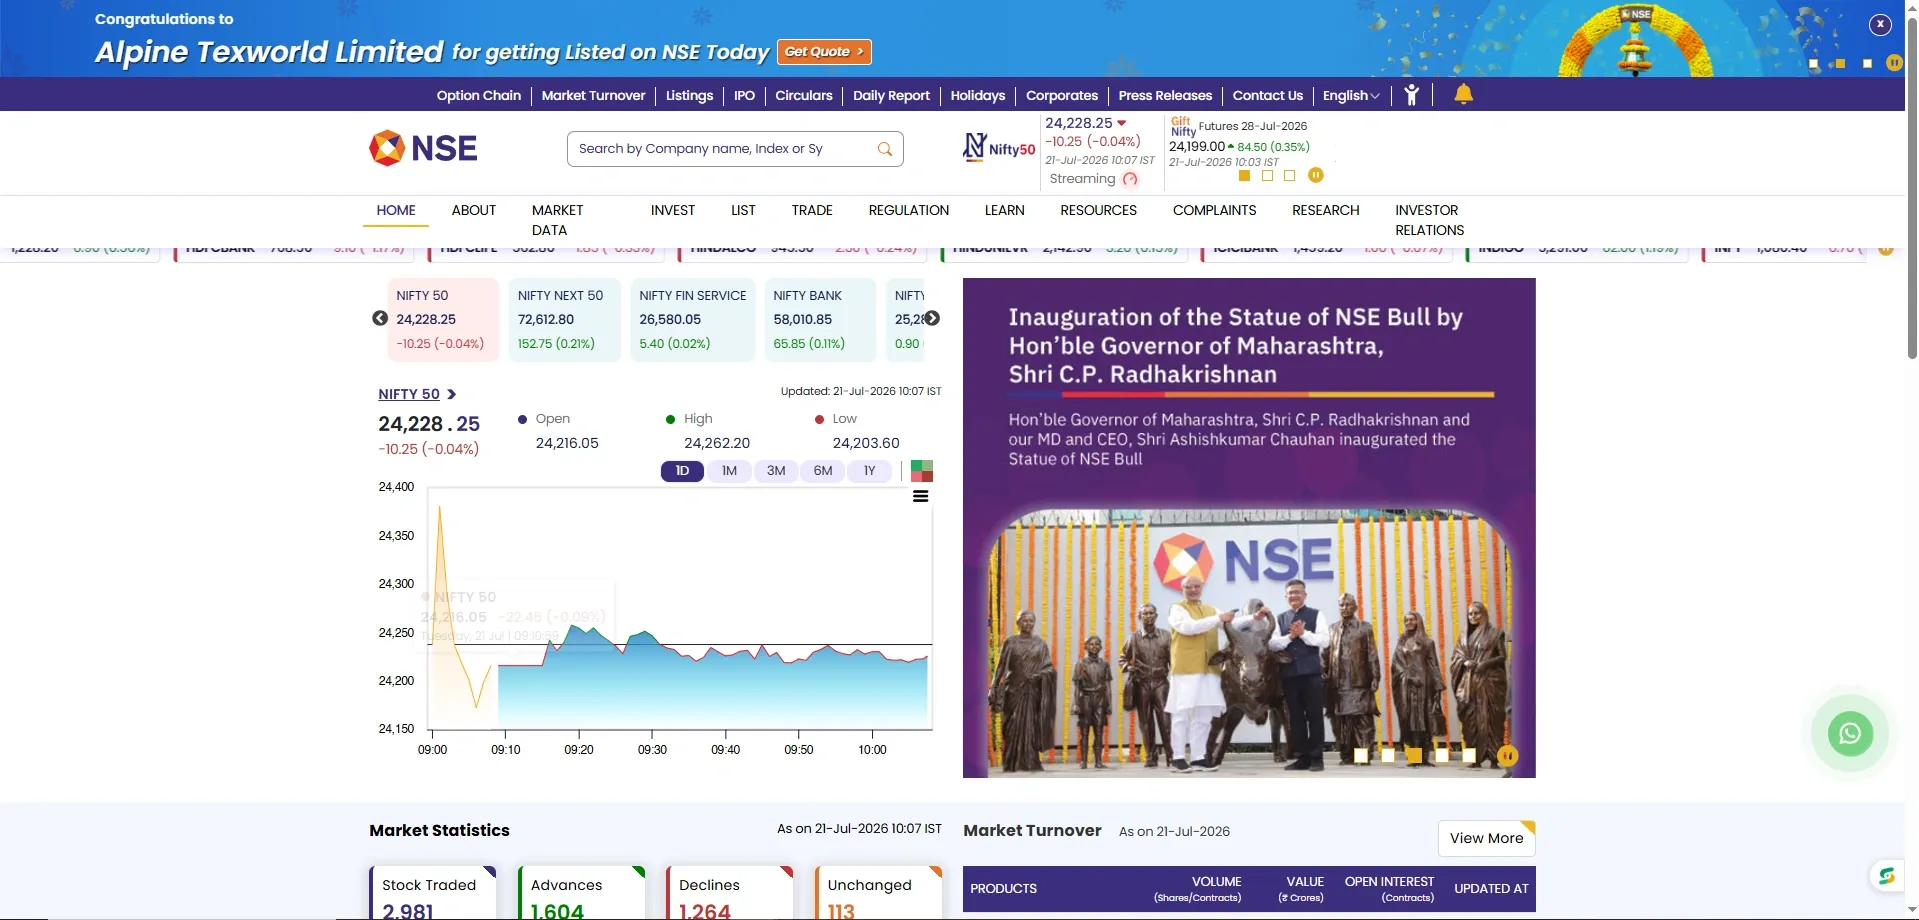
The official NSE website offers verified company filings, live market depth, and corporate announcements directly from the exchange, making it the most authoritative source for raw data.
Caveat: The interface is built for data lookup, not guided analysis.
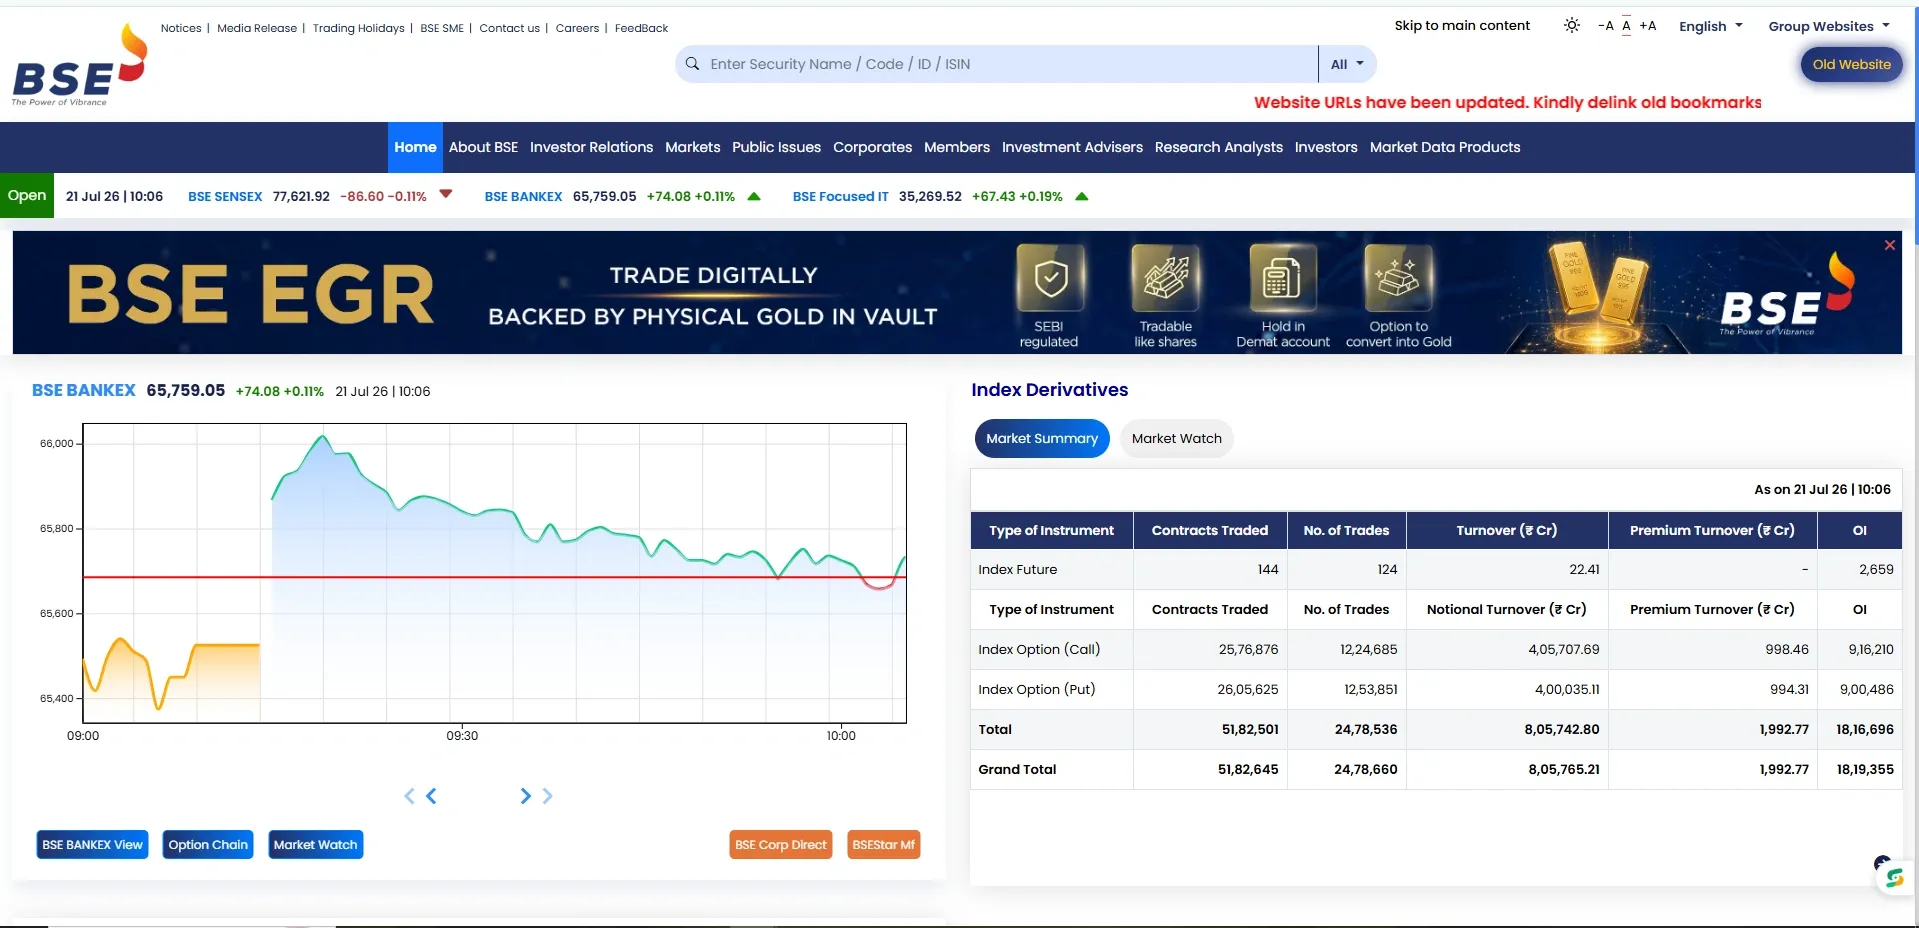
Like NSE, the BSE website provides official listed-company data and disclosures directly from the exchange, useful for cross-verifying numbers seen on other platforms.
Caveat: Best used as a verification source rather than a primary research tool.
A few thoughts before one relies on any given financial media platform: the origin of the data used (exchange-sourced data is preferable to aggregated estimates), whether there is any advisory/recommendation feature which discloses SEBI registration, and the value of the unpaid versus the paywall content. Unregistered advice is not regulated and has no accountability to the market. Read more on this in what is SEBI and its role.
There is no one best stock analysis website in India. It depends on the task at hand. Screener. in and Dhanarthi are good for fundamentals, Moneycontrol for news, TradingView for charts, and NSE or BSE for verifying data on the exchanges. Most serious investors I know use two or three of these sites in tandem.
Disclaimer: This article is for educational purposes only. It does not constitute investment advice. Please consult a SEBI-registered financial advisor before making investment decisions.
1. Which website is best for fundamental stock analysis in India?
Screener.in is widely regarded as the strongest option for fundamental depth, offering 10+ years of financial history per company on its free tier. Dhanarthi is a strong alternative for beginners who want AI-assisted screening with plain-language summaries.
2. Is Screener.in free to use?
Yes, Screener.in has a free tier covering most fundamental data needs. A paid plan adds features like data export and portfolio tracking for heavier users.
3. What is the best AI-based stock screener in India?
Dhanarthi's AI stock screener filters stocks by fundamental criteria and explains the results in plain language, built specifically for Indian retail investors researching NSE and BSE stocks.
4. Which platform gives SEBI-registered analyst recommendations?
Trade Brains Portal provides equity research reports from SEBI-registered Research Analysts, layered on top of standard fundamental data.
5. Can beginners use TradingView for Indian stocks?
Yes. TradingView carries extensive NSE and BSE charting data, though it is built for technical analysis rather than fundamental research, so beginners should pair it with a fundamentals-focused platform.
6. What is the difference between a stock analysis website and a stock screener?
A stock analysis website covers financials, news, and research broadly. A stock screener is a specific filtering tool within it that shortlists stocks by criteria like P/E, ROE, or market cap.
7. Are NSE India and BSE India useful for beginners?
Yes, for verification. Both exchange websites provide official filings and announcements directly from the source, useful for cross-checking data seen elsewhere, though they are not built for guided analysis.
8. Do I need a paid plan to analyse stocks properly?
Not necessarily. Free tiers on Screener.in, Dhanarthi, and Tickertape cover core fundamental data. Paid plans mainly add convenience features like export and deeper historical ranges.
9. Which website is best for combining news and stock data?
Moneycontrol covers company data alongside continuous market news, mutual funds, and commodities, making it useful for investors who want everything in one place.
10. How do I know if a stock analysis platform's data is reliable?
Check whether the platform sources data from NSE, BSE, or company filings directly. Cross-verify key numbers like ROE or debt levels against the exchange website before acting on them.
Share Market
IPO
Artificial Intelligence
Semi Conductor