
Breakout Trading Strategy: Meaning & How to Trade Breakouts
August 26, 2026



TABLE OF CONTENTS
Get AI Summary






Breakout trading strategy is a technique where traders enter a position when a stock's price moves beyond a defined support or resistance level, typically confirmed by a surge in trading volume. The idea is to catch a new trend early, right as it begins, rather than waiting for the move to become obvious to everyone else.
Breakout trading strategy is a technique in technical analysis where traders enter a trade as soon as a stock's price moves beyond a well-defined support or resistance level, aiming to catch a significant price move at its early stage rather than after the trend is already obvious. The strategy works on the idea that once enough buyers or sellers overwhelm a key level, price tends to continue moving in that direction, at least for a while.
Breakout trading is a scalable approach, it can be applied to intraday, swing, or positional trading depending on the trader's style and the timeframe used. It works across stocks, indices, and even commodities, and is especially popular during periods where a stock has been consolidating in a tight range for some time, since consolidation phases tend to precede sharper directional moves once the range finally breaks.
The terms breakout and breakdown are often used interchangeably in casual conversation, but they describe opposite price movements.
| Term | What Happens | Typical Signal |
|---|---|---|
| Breakout | Price moves above a resistance level | Bullish, potential new uptrend |
| Breakdown | Price moves below a support level | Bearish, potential new downtrend |
Both movements represent a meaningful shift in market sentiment, and traders use the same core principles, volume confirmation, candle close, and stop-loss placement, to trade both directions. A breakout trader isn't limited to only buying, shorting a breakdown below support follows the identical logic in the opposite direction.
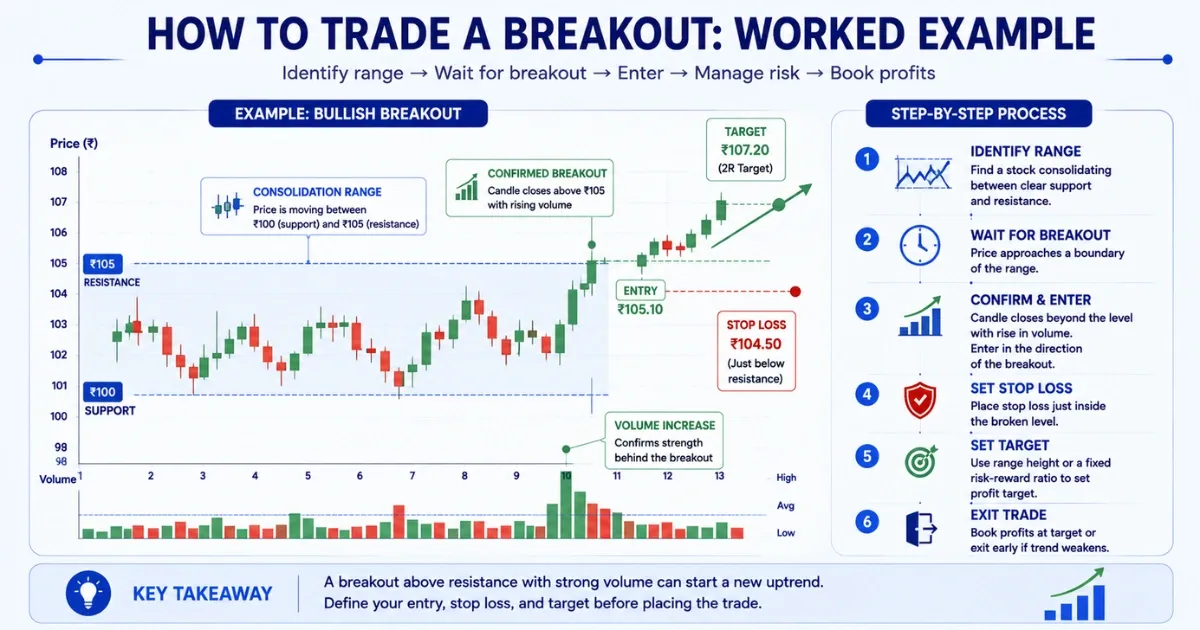
Step-by-step process:
Worked example: A stock has been consolidating between Rs 100 (support) and Rs 105 (resistance) for several sessions. Price closes above Rs 105 on rising volume. A trader enters at Rs 105.10, places a stop loss at Rs 104.50 (just below the former resistance, now acting as support), and sets a profit target around Rs 107.20, based on a roughly 2:1 reward-to-risk ratio. If the stock breaks down below Rs 100 instead, the same logic applies in reverse for a short trade.
One of the most important, and most frequently overlooked, details in breakout trading is how a breakout is confirmed. Many beginners enter as soon as price touches or briefly pierces a level, only to get stopped out when price snaps back inside the range moments later.
A more reliable approach waits for a candle to actually close beyond the level, on the relevant timeframe, rather than reacting to a mere wick or intraday spike through the level. A close confirms genuine conviction behind the move, while a brief pierce followed by a pullback often indicates the level is still holding.
Volume adds a second layer of confirmation. A breakout accompanied by a clear increase in trading volume signals that real participation is behind the move, whereas a breakout on thin volume is more likely to fail and reverse. Combining both, a confirmed candle close plus rising volume, meaningfully reduces the number of false signals a breakout trader acts on.
The Opening Range Breakout, or ORB, is one of the most widely used breakout strategies among Indian intraday traders, built specifically around how Indian markets behave right after the open.
How ORB works: The opening range is the high and low price established during the first few minutes of trading after the NSE opens at 9:15 AM. Common windows are 15, 30, or 60 minutes. Once this window closes, the high becomes the Opening Range High (ORH) and the low becomes the Opening Range Low (ORL). A candle close above the ORH signals a bullish breakout, while a close below the ORL signals a bearish breakdown.
Worked example: Suppose Nifty opens at 9:15 AM and trades between 22,850 and 22,920 during the first fifteen minutes. If a later candle closes above 22,920, traders interpret this as a bullish breakout from the opening range and may enter a long trade, placing a stop loss near the opening range low. The reverse applies if price closes below 22,850.
ORB works because the market's opening phase reflects accumulated overnight sentiment, news reactions, and early institutional activity, all compressed into a short, information-dense window that often sets the tone for the rest of the session.
Not every ORB window suits every trader equally. The choice of timeframe involves a trade-off between how often signals appear and how reliable they tend to be.
| Timeframe | Characteristics | Best Suited For |
|---|---|---|
| 15-minute ORB | Fires more frequently, more early-session noise | Experienced traders comfortable with faster decisions |
| 30-minute ORB | More stable, cleaner setups, avoids early whipsaws | Beginners and intermediate traders |
| 60-minute ORB | Fewer but higher-conviction signals | Traders preferring confirmed momentum over speed |
For most beginners, the 30-minute or 60-minute opening range tends to work better than the 15-minute version, since the extra time allows early volatility and noise to settle before a genuine directional bias emerges.
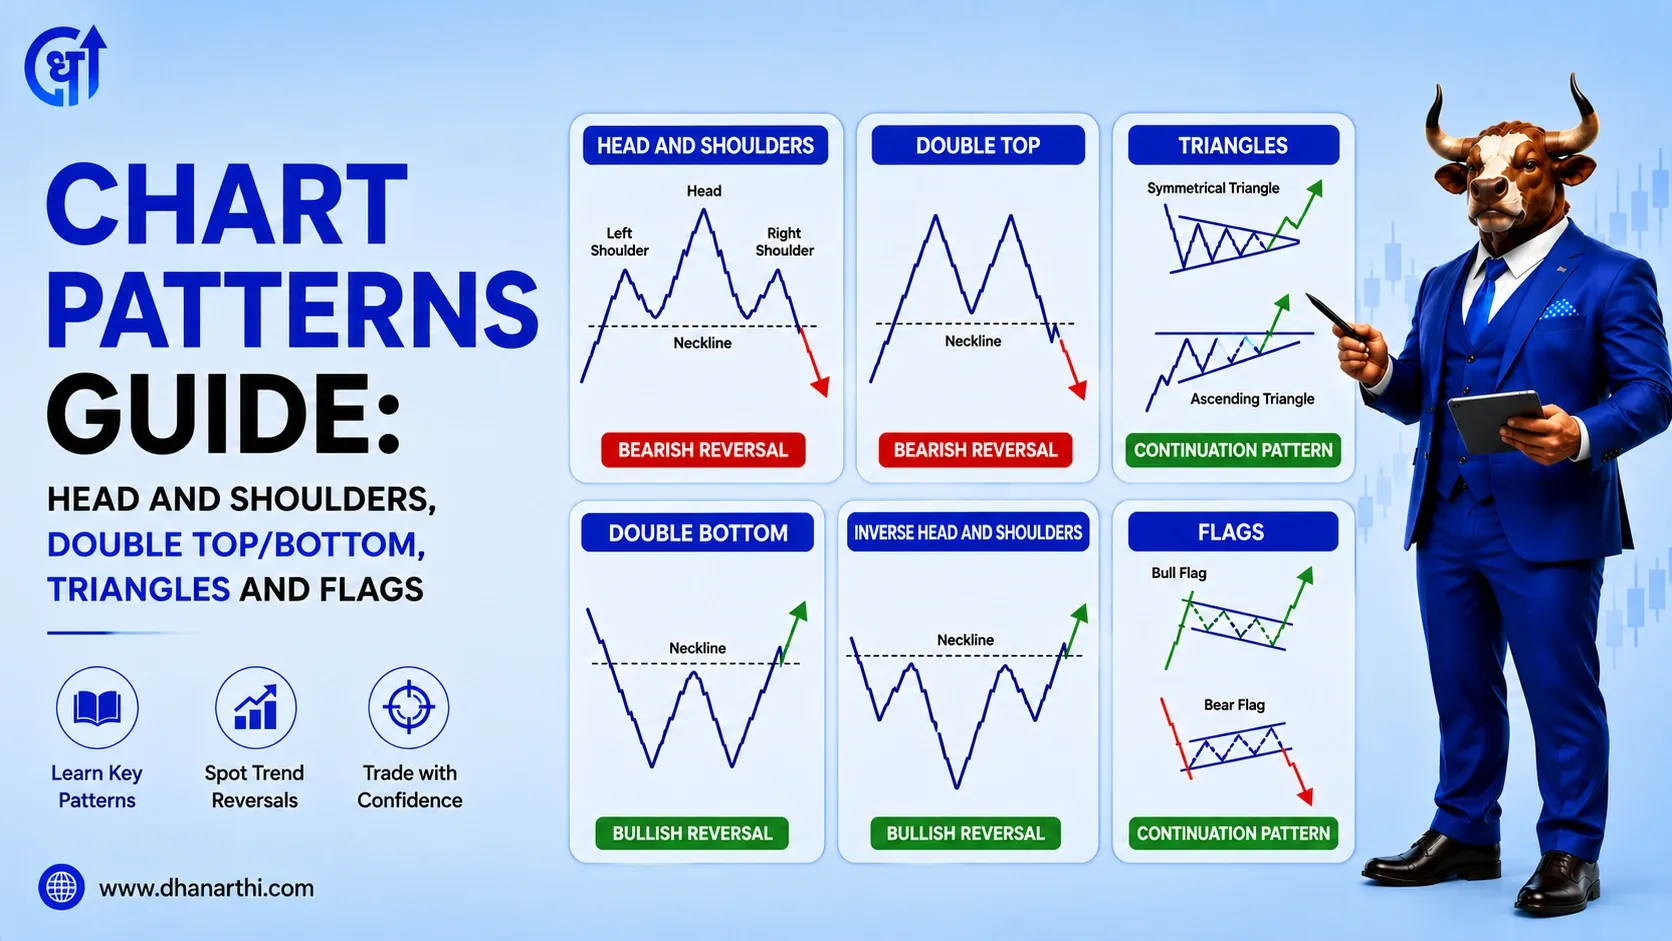
Breakouts are not limited to simple horizontal support and resistance levels, they also apply directly to structured chart patterns like triangles, flags, and the neckline of a head and shoulders pattern. In each case, the same core principles apply: wait for a confirmed close beyond the pattern's boundary, check for rising volume, and use the pattern's measured height to estimate a realistic price target.
Traders who already understand chart pattern structure often find breakout trading a natural extension, since a triangle or flag breakout is really just a specific, well-defined version of the same support/resistance breakout concept applied to a recognizable shape.
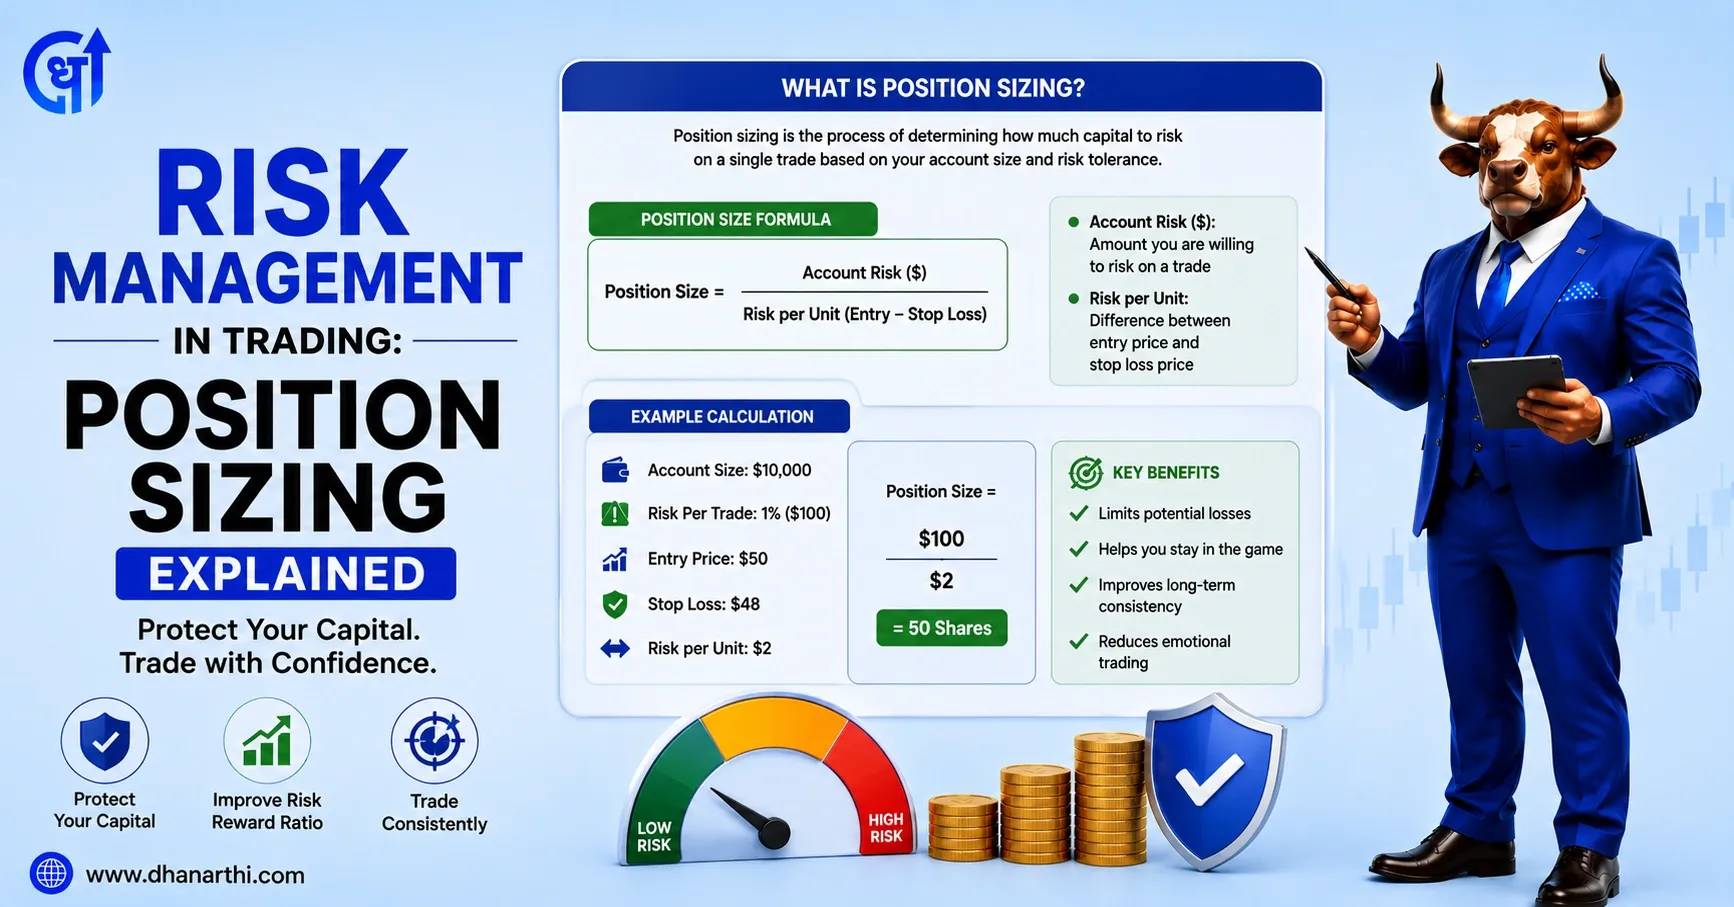
Breakout trading carries real volatility risk, since breakouts often occur alongside sharp price swings that can widen stop-losses if not planned carefully. A disciplined approach to stop loss placement and position sizing matters more in breakout trading than in slower-moving strategies, precisely because entries happen right as volatility is expanding.
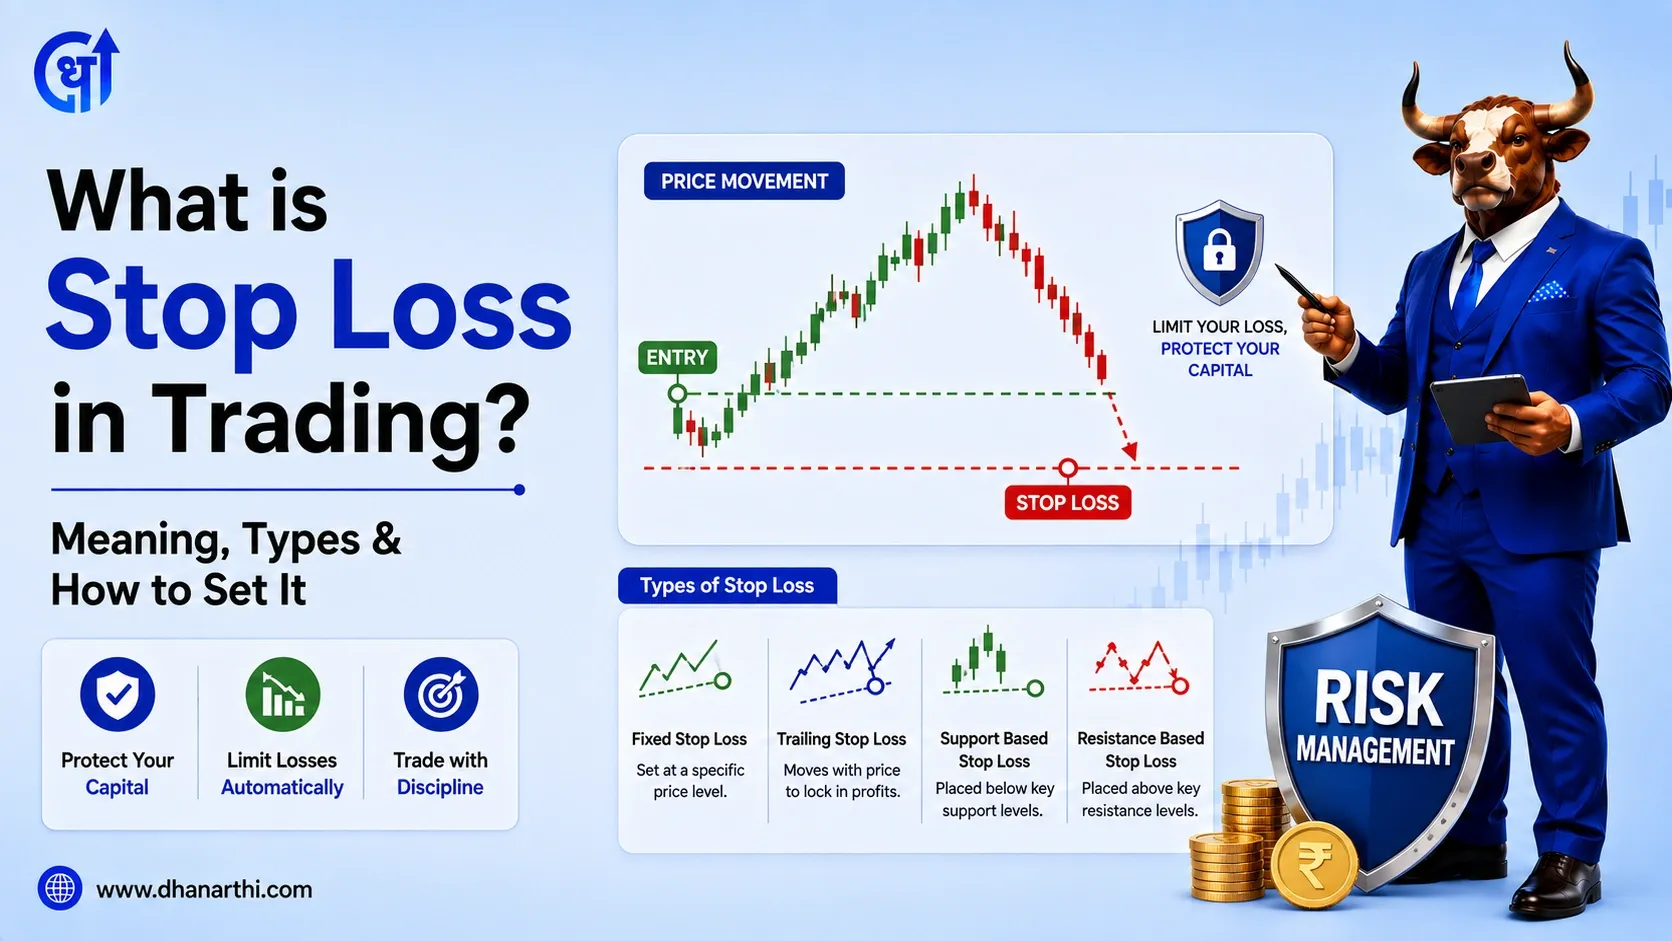
A common approach places the stop loss just inside the broken level, close enough to limit losses if the breakout fails, but far enough to avoid getting stopped out by normal post-breakout volatility. Calculating position size based on this stop-loss distance, rather than trading a fixed number of shares regardless of the setup, keeps risk consistent across different breakout trades.
A false breakout, sometimes called a "fakeout," happens when price briefly moves beyond a support or resistance level, triggering breakout entries, only to reverse back inside the range shortly after. This is one of the most common ways breakout traders lose money.
False breakouts tend to happen more often in low-volume conditions, in choppy or range-bound broader markets, or when traders enter too early on a wick rather than waiting for a confirmed candle close. Reducing false breakout losses generally comes down to three habits: waiting for a candle close rather than an intraday touch, checking for a genuine volume increase rather than assuming it, and being more cautious around low-volatility, sideways market conditions where breakouts are inherently less reliable.
Breakout trading requires patience to wait for genuine setups and discipline to accept that a portion of trades will fail as false breakouts, even when every step is followed correctly. The edge comes from consistently managing risk across many trades, not from being right on any single breakout.
Breakout trading strategy, at its core, is about entering a move as it begins rather than after it's already obvious to the broader market. Whether trading a simple support/resistance level, an Opening Range Breakout on Nifty, or a chart pattern's neckline, the same principles apply: wait for a confirmed candle close, check for genuine volume, and manage risk with a clear stop loss, since false breakouts are a normal part of this strategy rather than a sign something went wrong.
This article is for educational purposes only. It does not constitute investment advice. Please consult a SEBI-registered financial advisor before making investment decisions.
Disclaimer: This article is for educational purposes only. It does not constitute investment advice. Please consult a SEBI-registered financial advisor before making investment decisions.
1. What is breakout trading strategy?
Breakout trading strategy is a technique where traders enter a position when price moves beyond a defined support or resistance level, typically confirmed by increased volume, aiming to catch a new trend in its early stages.
2. What is breakout meaning in trading?
Breakout meaning in trading refers to price moving above a resistance level or below a support level with increased volume, signaling a potential trend continuation or reversal.
3. What is the difference between a breakout and a breakdown?
A breakout occurs when price moves above a resistance level, generally considered bullish. A breakdown occurs when price moves below a support level, generally considered bearish.
4. How do I confirm a real breakout?
A real breakout is generally confirmed by a candle closing beyond the support or resistance level, along with a noticeable increase in trading volume, rather than just a brief price spike or wick through the level.
5. What is Opening Range Breakout (ORB)?
Opening Range Breakout, or ORB, is an intraday strategy that uses the high and low price established in the first few minutes of trading, commonly 15, 30, or 60 minutes, with a close beyond either level signaling breakout direction.
6. What is the best timeframe for ORB trading?
The 30-minute and 60-minute opening range windows are generally considered better suited for beginners since they avoid early-session noise, while the 15-minute window fires more frequently but with more false signals.
7. What is a false breakout?
A false breakout, or fakeout, happens when price briefly moves beyond a support or resistance level and then reverses back inside the range shortly after, often trapping traders who entered too early.
8. How can I avoid false breakouts?
Waiting for a confirmed candle close rather than an intraday touch, checking for genuine volume confirmation, and being cautious in choppy or range-bound markets can help reduce false breakout losses.
9. Is breakout trading good for intraday trading in India?
Yes, breakout trading, especially the Opening Range Breakout strategy, is widely used for intraday trading in India, since it provides clear, structured entry and exit levels based on early session price action.
10. Do breakout traders need a stop loss?
Yes, a stop loss is essential in breakout trading since false breakouts occur regularly, and a predefined exit point limits losses when a breakout fails to sustain its initial move.
11. Can breakout trading be applied to chart patterns?
Yes, breakout trading applies directly to chart patterns like triangles, flags, and the neckline of a head and shoulders pattern, using the same principles of confirmed close and volume to trade the pattern's breakout.
12. What risk-reward ratio is common in breakout trading?
Many breakout traders target a risk-reward ratio of around 1:2, meaning the profit target is roughly twice the distance of the stop loss, though this can vary based on the specific setup and market conditions.
Share Market
IPO
Artificial Intelligence
Semi Conductor