





SGB vs Gold ETF: Which Is Better in 2026?
October 22, 2026



TABLE OF CONTENTS
Get AI Summary





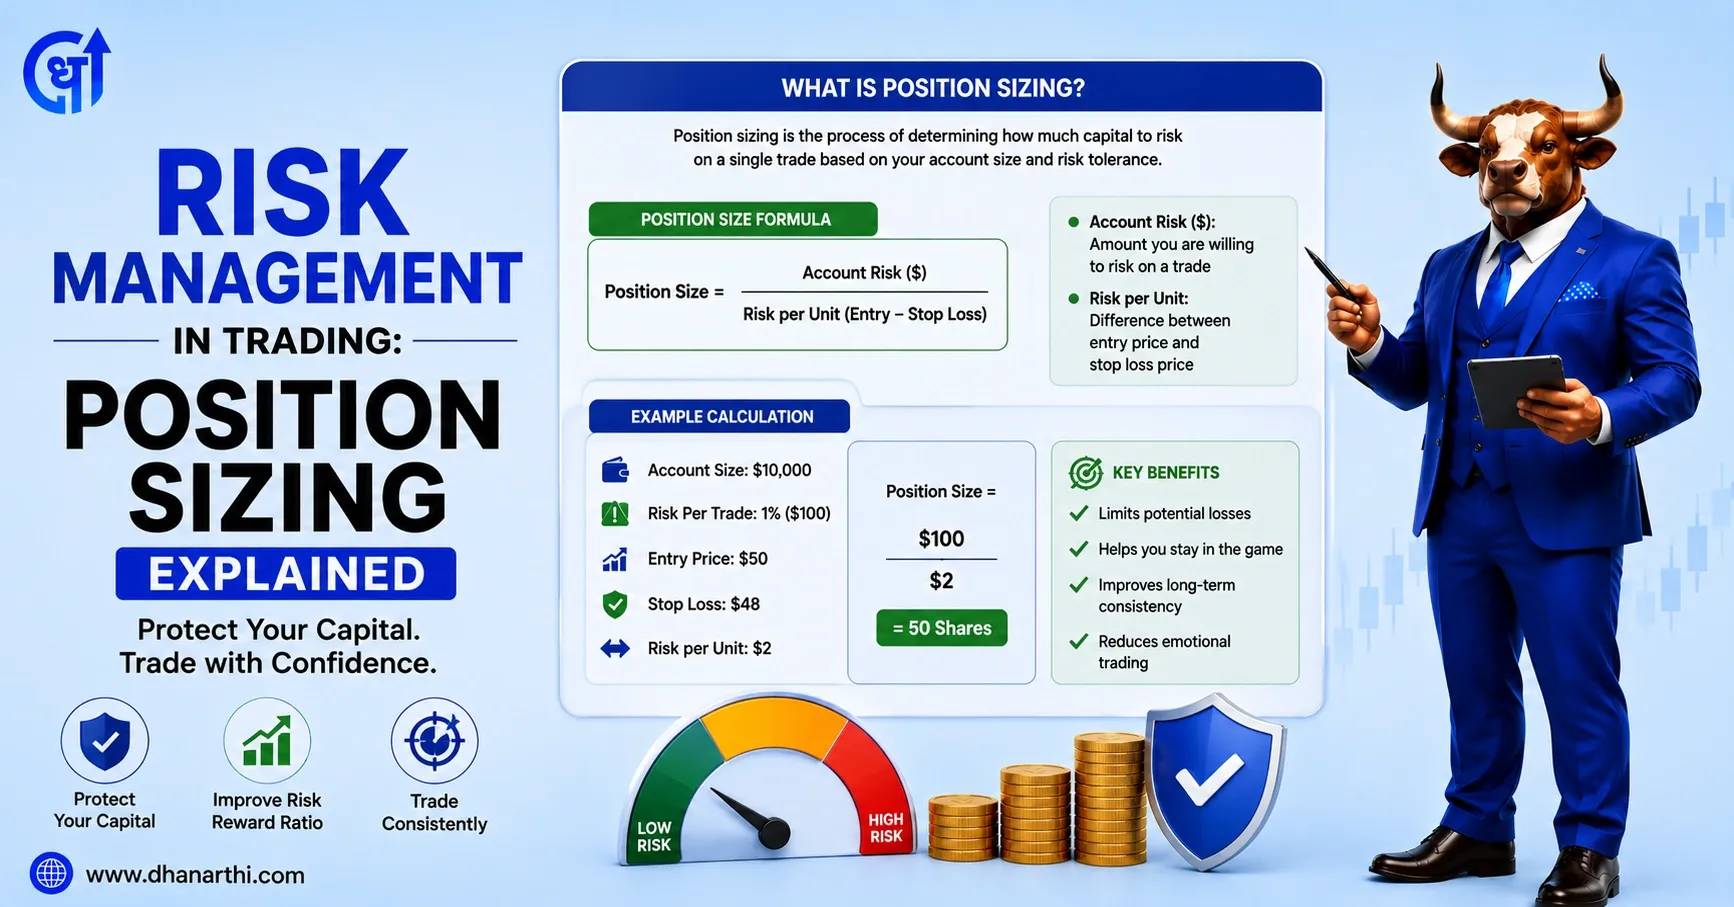
Position sizing is the process of deciding how much capital to allocate to a single trade based on account size, risk tolerance, and the distance to a stop loss. It is one of the core pillars of risk management in trading, ensuring that no single losing trade can significantly damage an entire portfolio, regardless of how confident a trader feels about the setup.
Risk management in trading refers to the set of practices traders use to protect their capital from large, account-damaging losses. It covers several tools working together, stop losses, diversification, risk-reward ratios, and position sizing, but position sizing is often considered the most important single piece, since it directly determines how much capital is exposed on any given trade.
Even a strategy with a strong track record can wipe out an account if position sizing is handled poorly. A trader who risks too much on a single trade, or who increases size impulsively after a string of losses, can turn a series of small, manageable losses into a portfolio-ending event. Risk management exists precisely to prevent that outcome.
Research Stocks Smarter with Dhanarthi AI Screener
Analyze 5,000+ NSE & BSE stocks with 150+ custom filters, real-time volume breakout scans, and transparent fundamental data.
Use Dhanarthi Screener
Position sizing is the process of determining how many shares or lots to buy or sell in a trade, based on account size, the percentage of capital being risked, and the distance between the entry price and the stop loss. Unlike choosing when to enter a trade, position sizing focuses entirely on how much capital is exposed once the trade is placed.
Many beginner traders focus almost all their attention on finding the "right" entry point, while giving little thought to how much of their capital that entry actually risks. In practice, an average entry with well-calculated position sizing tends to outperform a great entry with reckless sizing over a long enough series of trades, since consistent risk control is what keeps a trader in the game long enough for a good strategy to play out.
The standard position sizing formula converts a trader's risk tolerance directly into a specific number of shares to buy.
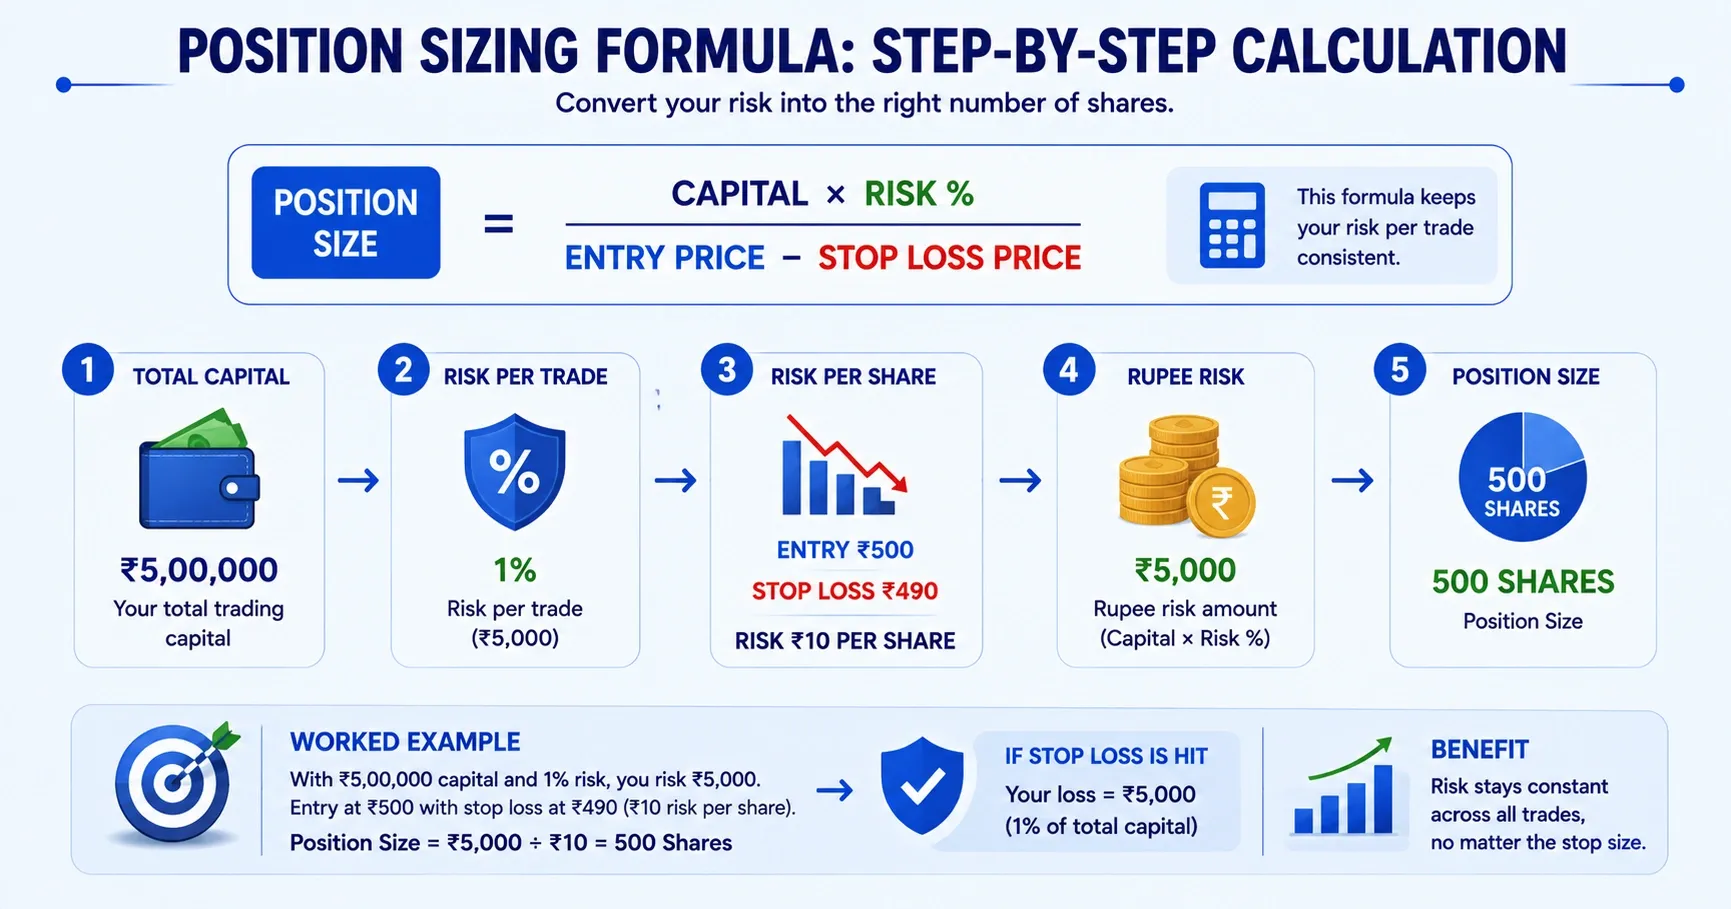
Formula: Position Size = (Capital x Risk %) / (Entry Price - Stop Loss Price)
Step-by-step:
| Step | Action |
|---|---|
| 1 | Decide total trading capital |
| 2 | Decide risk percentage per trade, commonly 1% or 2% |
| 3 | Calculate rupee risk amount: Capital x Risk % |
| 4 | Calculate risk per share: Entry Price - Stop Loss Price |
| 5 | Divide rupee risk amount by risk per share to get position size |
Worked example: A trader has Rs 5,00,000 in trading capital and risks 1% per trade, which is Rs 5,000. They plan to buy a stock at Rs 500 with a stop loss at Rs 490, a risk of Rs 10 per share. Position Size = Rs 5,000 / Rs 10 = 500 shares. If the stop loss is hit, the trader loses exactly Rs 5,000, or 1% of total capital, regardless of how the trade was chosen.
This formula works the same way across any stock price or stop-loss distance, which is precisely what makes it useful, it keeps risk consistent across trades rather than varying wildly based on which stock happens to be traded.
The most widely used position sizing approach among both professional and retail traders is the fixed percentage rule, risking the same percentage of total capital on every trade regardless of how confident the trader feels about the setup.
| Rule | Risk Per Trade | Suited For |
|---|---|---|
| 1% Rule | 1% of total capital | Conservative traders, smaller accounts, or beginners still building consistency |
| 2% Rule | 2% of total capital | More experienced traders comfortable with slightly higher variance |
| Capital | 1% Risk | 2% Risk |
| --- | --- | --- |
| Rs 1,00,000 | Rs 1,000 | Rs 2,000 |
| Rs 5,00,000 | Rs 5,000 | Rs 10,000 |
| Rs 10,00,000 | Rs 10,000 | Rs 20,000 |
Risking more than 2-3% per trade is generally considered aggressive, since it takes only a handful of consecutive losses to meaningfully damage the account. Position sizing beyond this range usually signals that a trader is prioritizing potential upside over capital preservation, which tends to work against long-term consistency.
Position sizing alone does not determine whether a trading strategy is profitable, it has to be combined with the risk-reward ratio and win rate to judge whether a strategy actually makes sense over time.
Risk-Reward Ratio: compares potential profit to potential loss on a trade. A 1:2 risk-reward ratio means risking Rs 1 to potentially make Rs 2.
Expectancy: combines this with win rate to show whether a strategy is profitable on average: Expectancy = (Win Rate x Average Win) - (Loss Rate x Average Loss)
Worked example: A trader with a 40% win rate and a 1:2 risk-reward ratio, risking Rs 1,000 to make Rs 2,000 on each trade, has an expectancy of (0.40 x 2,000) - (0.60 x 1,000) = 800 - 600 = Rs 200 positive expectancy per trade, even though the trader loses more often than they win.
This is a critical point most beginners miss: proper position sizing controls how much is lost on losing trades, but it is the combination of win rate and risk-reward ratio that determines whether the overall strategy makes money over a large number of trades.
The fixed percentage approach described above is technically called fixed fractional position sizing, and it remains the standard starting point for most traders. A few more advanced methods exist for traders who want to go further.
Kelly Criterion: A mathematical formula that calculates the theoretically optimal percentage of capital to risk based on win rate and risk-reward ratio. Its main drawback is that it reduces every trade outcome to just two values, win or loss, without accounting for the varying size or volatility of individual trades, which makes the raw Kelly percentage often too aggressive to use directly in practice.
Optimal F: Developed as a refinement addressing some of Kelly's limitations, Optimal F tests a range of position sizes against a strategy's historical returns to find the sizing level that would have produced the best results for that specific set of trades.
Most retail traders, including the majority of Indian retail traders, do not need to use Kelly Criterion or Optimal F directly. These methods are worth knowing about, but fixed fractional sizing at 1-2% per trade covers the large majority of real-world trading needs without the added complexity.
Position sizing calculated per trade in isolation can still miss a bigger risk: how multiple open positions interact with each other. A trader who correctly sizes five individual trades at 1% risk each might assume total portfolio risk is capped at 5%. But if those five positions are all IT sector stocks, or all highly correlated with each other, they can move together during a sector-wide decline, effectively behaving like one large, concentrated position rather than five independent ones.
This is why risk management extends beyond single-trade position sizing into portfolio-level thinking. Diversifying across sectors, and being conscious of how correlated the open positions actually are, matters as much as getting the position sizing formula right on each individual trade.
A common and costly mistake is increasing position size after a losing streak in an attempt to recover losses more quickly, sometimes called revenge trading. This works directly against sound risk management for two reasons.
First, a losing streak often signals that current market conditions may not suit the trading strategy being used, making it a poor time to increase risk. Second, from a pure math standpoint, digging out of a drawdown requires a disproportionately larger gain than the loss that created it, a 20% loss requires a 25% gain just to recover, and a 50% loss requires a 100% gain. Increasing position size to chase that recovery faster only raises the odds of an even deeper drawdown.
The fixed percentage approach naturally protects against this, since risking a consistent 1-2% of capital means the rupee amount at risk automatically shrinks as the account value shrinks during a losing streak, rather than staying fixed or increasing.

Confused about chart patterns & stock analysis?
Use
Dhanarthi Stock Guru
to chat, analyze price patterns, and ask questions directly.
Position sizing is a mechanical discipline, not a creative one. Traders who treat it as a fixed rule to follow every single time, rather than something to adjust based on how a trade "feels," tend to have far more consistent long-term outcomes. For traders building broader trading skills, understanding how to evaluate and pick stocks alongside disciplined position sizing gives a more complete risk management foundation than either piece alone.
Risk management in trading, and position sizing specifically, is less about predicting which trades will win and more about controlling the damage when a trade goes wrong, since losing trades are a normal and unavoidable part of trading. The position sizing formula converts a trader's risk tolerance into a specific number of shares, keeping losses consistent regardless of which stock is being traded. Combined with a sound risk-reward ratio, awareness of portfolio-level correlation, and the discipline to avoid increasing size after losses, position sizing becomes the mechanism that keeps a trader in the game long enough for their overall strategy to work.
Disclaimer: This article is for educational purposes only. It does not constitute investment advice. Please consult a SEBI-registered financial advisor before making investment decisions.
1. What is position sizing in trading?
Position sizing is the process of deciding how much capital to allocate to a single trade, based on account size, risk tolerance, and the distance between entry price and stop loss.
2. What is the position sizing formula?
The position sizing formula is Position Size = (Capital x Risk %) / (Entry Price - Stop Loss Price), which converts a trader's risk tolerance directly into a specific number of shares to buy.
3. What is risk management in trading?
Risk management in trading refers to the practices used to protect capital from large losses, including position sizing, stop losses, diversification, and maintaining a sound risk-reward ratio.
4. What is the 1 percent rule in trading?
The 1% rule means a trader risks no more than 1% of their total trading capital on any single trade, helping ensure that a string of losses doesn't significantly damage the overall account.
5. How much should I risk per trade?
Most traders risk between 1% and 2% of their total capital per trade. Risking more than 2-3% is generally considered aggressive and increases the chance of significant drawdowns from a handful of consecutive losses.
6. What is risk-reward ratio in trading?
Risk-reward ratio compares the potential profit on a trade to the potential loss. A 1:2 risk-reward ratio means risking a fixed amount to potentially gain twice that amount if the trade works out.
7. Can a strategy be profitable with a low win rate?
Yes, a strategy with a win rate below 50% can still be profitable if the risk-reward ratio is favorable enough, since a few larger wins can outweigh a higher number of smaller losses.
8. What is fixed fractional position sizing?
Fixed fractional position sizing means risking a consistent percentage of total capital, such as 1% or 2%, on every trade, with the rupee amount at risk adjusting automatically as the account grows or shrinks.
9. Why is increasing position size after a loss risky?
Increasing position size after a loss to recover it faster increases the chance of an even deeper drawdown, since larger losses require disproportionately larger gains to recover from.
10. Does position sizing account for multiple open positions?
Basic position sizing calculates risk per individual trade, but traders also need to consider portfolio-level risk, since correlated positions, like several stocks in the same sector, can behave like one larger concentrated position.
11. What is the Kelly Criterion in position sizing?
The Kelly Criterion is a formula that calculates a theoretically optimal position size based on win rate and risk-reward ratio, though its raw output is often considered too aggressive for practical use without adjustment.
12. Is position sizing more important than picking the right stock?
Position sizing does not replace stock selection, but consistent risk control through proper position sizing tends to matter more for long-term account survival than finding the perfect entry on any single trade.
Share Market
IPO
Artificial Intelligence
Semi Conductor