
Bollinger Bands Explained: Formula & Trading Strategies
August 19, 2026



TABLE OF CONTENTS
Get AI Summary





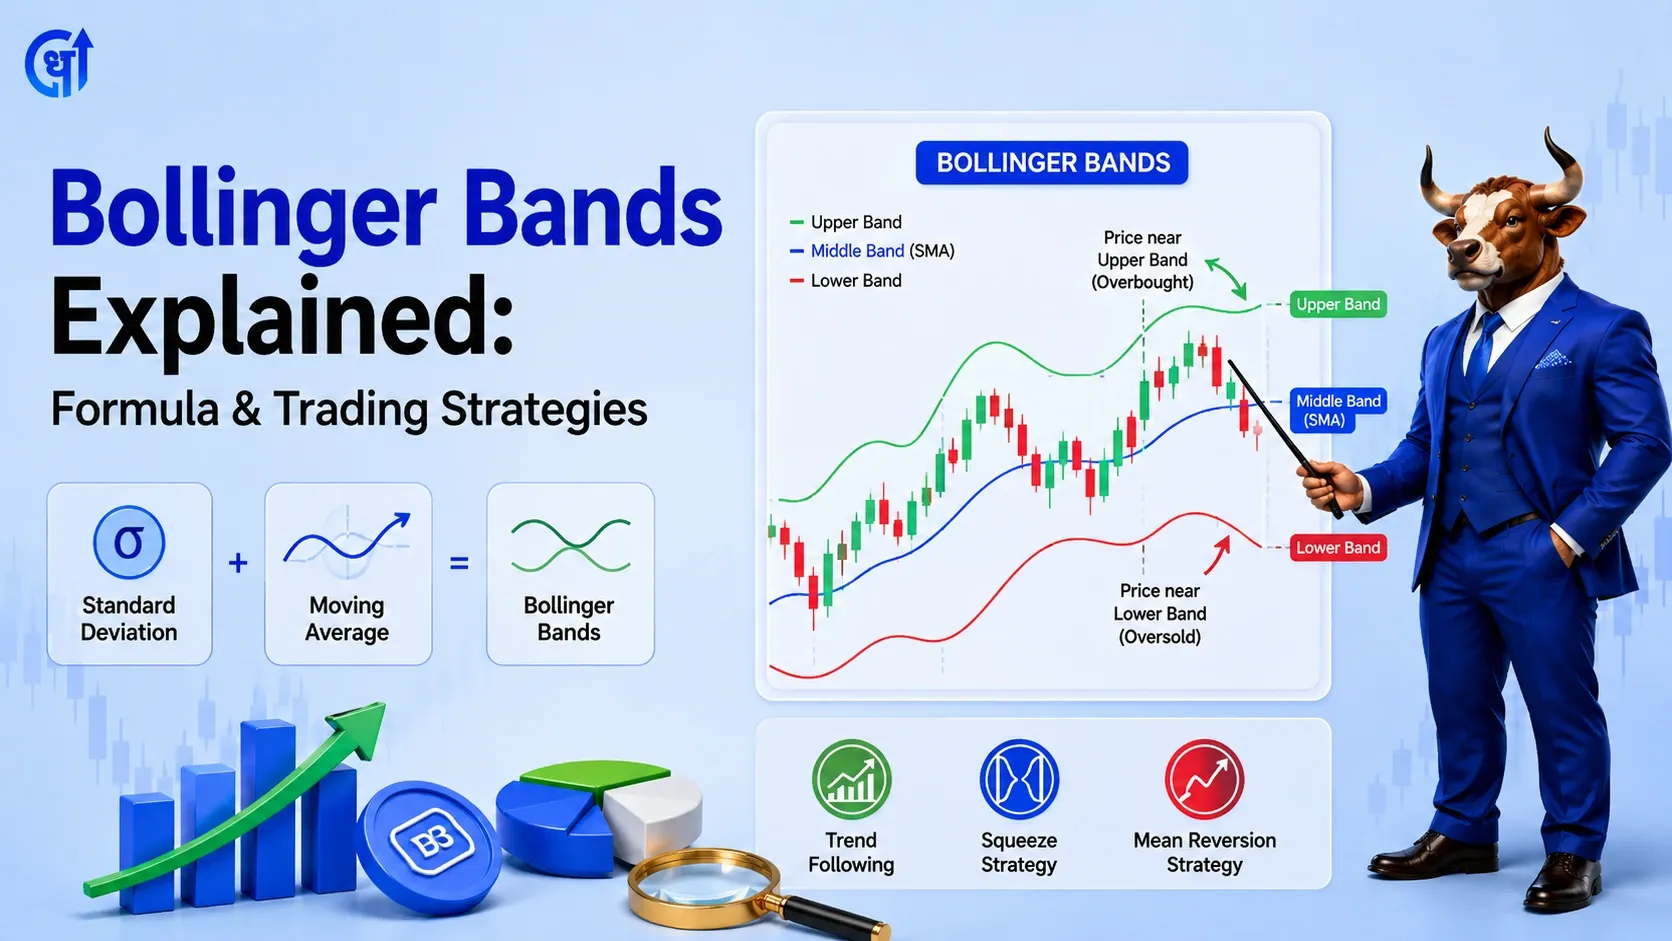
Bollinger Bands are a technical analysis tool that measures price volatility using three lines: a middle band (a 20-period simple moving average) and an upper and lower band placed two standard deviations away from it. Developed by John Bollinger in the 1980s, the bands widen when volatility rises and contract when volatility falls, helping traders spot potential breakouts, reversals, and overbought or oversold conditions.
Bollinger Bands is a technical analysis indicator developed by John Bollinger in the early 1980s that combines a moving average with a measure of price volatility. It consists of three lines plotted directly on a price chart: a middle band, an upper band, and a lower band.
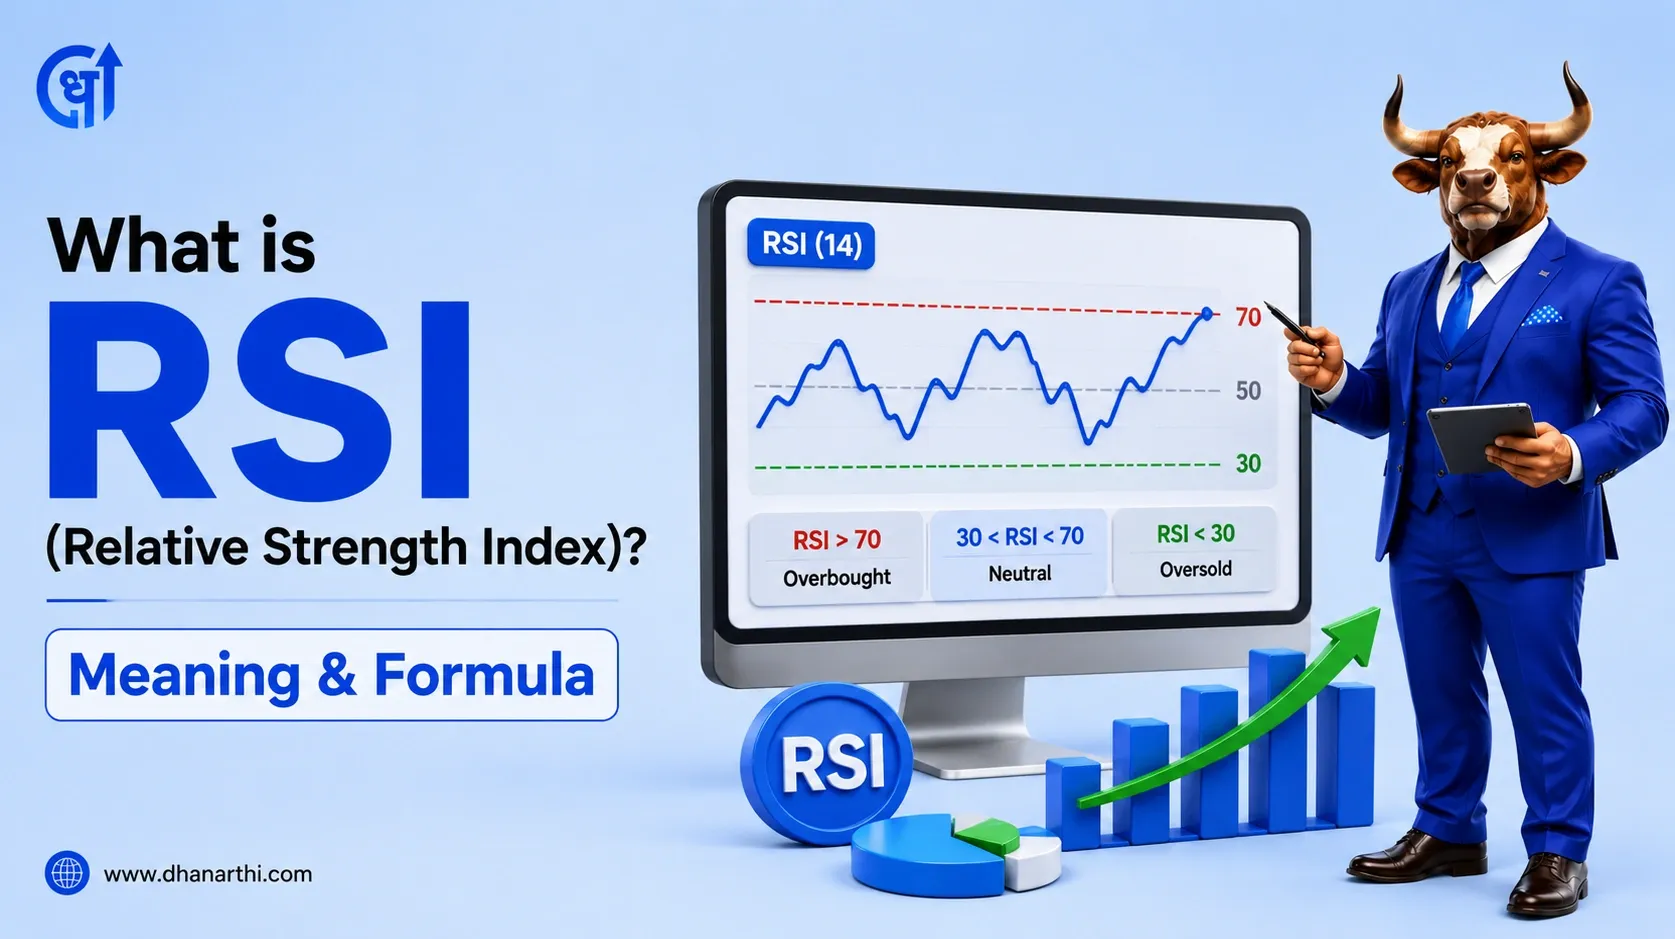
Unlike a fixed-range oscillator such as RSI, Bollinger Bands adapt to changing market conditions. When a stock becomes more volatile, the bands widen. When a stock settles into a calm, range-bound phase, the bands contract. This makes Bollinger Bands one of the more visually intuitive indicators, since the "shape" of the bands itself tells a story about market conditions, even before looking at where price sits relative to them.
Bollinger Bands work across stocks, indices, F&O, and even commodities, which is why they are widely used by Indian retail traders on platforms like Zerodha Kite, Upstox, and TradingView India.
Bollinger Bands are built from three components, all derived from the same simple moving average and standard deviation.
| Component | Formula | What It Represents |
|---|---|---|
| Middle Band | 20-period Simple Moving Average (SMA) | The average price over the last 20 periods, the baseline |
| Upper Band | Middle Band + (2 x Standard Deviation) | Upper boundary of expected price movement |
| Lower Band | Middle Band - (2 x Standard Deviation) | Lower boundary of expected price movement |
Worked example: If a stock's 20-day SMA is Rs 1,000 and the standard deviation of its price over that period is Rs 25, the upper band = 1,000 + (2 x 25) = Rs 1,050, and the lower band = 1,000 - (2 x 25) = Rs 950. As long as the stock's volatility stays roughly the same, price is statistically likely to trade within this Rs 950 to Rs 1,050 range.
The default settings, a 20-period SMA with 2 standard deviations, work well for most daily charts. Some traders adjust the period to 10 for intraday trading or 50 for longer-term swing analysis, depending on their timeframe.
The most common beginner interpretation of Bollinger Bands is treating the upper band as an automatic sell signal and the lower band as an automatic buy signal, based on the idea of mean reversion, the assumption that price will eventually revert back toward its average.
This works reasonably well in range-bound or sideways markets. But it is also the single most common mistake traders make with this indicator: assuming price touching a band always means a reversal is coming. In a strong uptrend, price can hug the upper band for many consecutive sessions without ever reverting to the middle band, and a trader shorting every touch of the upper band in that kind of trend will lose money repeatedly.
The more reliable way to read Bollinger Bands is to combine band position with trend direction. If the broader trend is up, price riding the upper band suggests strength, not an automatic reversal. If the broader trend is down, price hugging the lower band suggests weakness continuing, not an automatic bounce. Band touches are more meaningful as reversal signals in range-bound markets than in strongly trending ones.
A Bollinger Bands squeeze occurs when the upper and lower bands contract tightly toward the middle band, signaling that price volatility has dropped to unusually low levels. This compression often happens before a significant price move, since markets tend to cycle between periods of low volatility and high volatility.
The critical point most beginners get wrong: the squeeze tells you that a big move is likely coming, not which direction it will go. A squeeze can resolve into either a bullish or bearish breakout with roughly equal probability at the outset. Traders should not assume a direction just because the bands have tightened.
The standard approach is to wait for a confirmed breakout candle, one that closes cleanly outside the band, rather than acting on the squeeze itself. On Nifty and Bank Nifty charts, this squeeze-to-breakout pattern is commonly watched on 5-minute and 15-minute timeframes by intraday traders, since index volatility compression often precedes sharp directional moves around news events or expiry sessions.
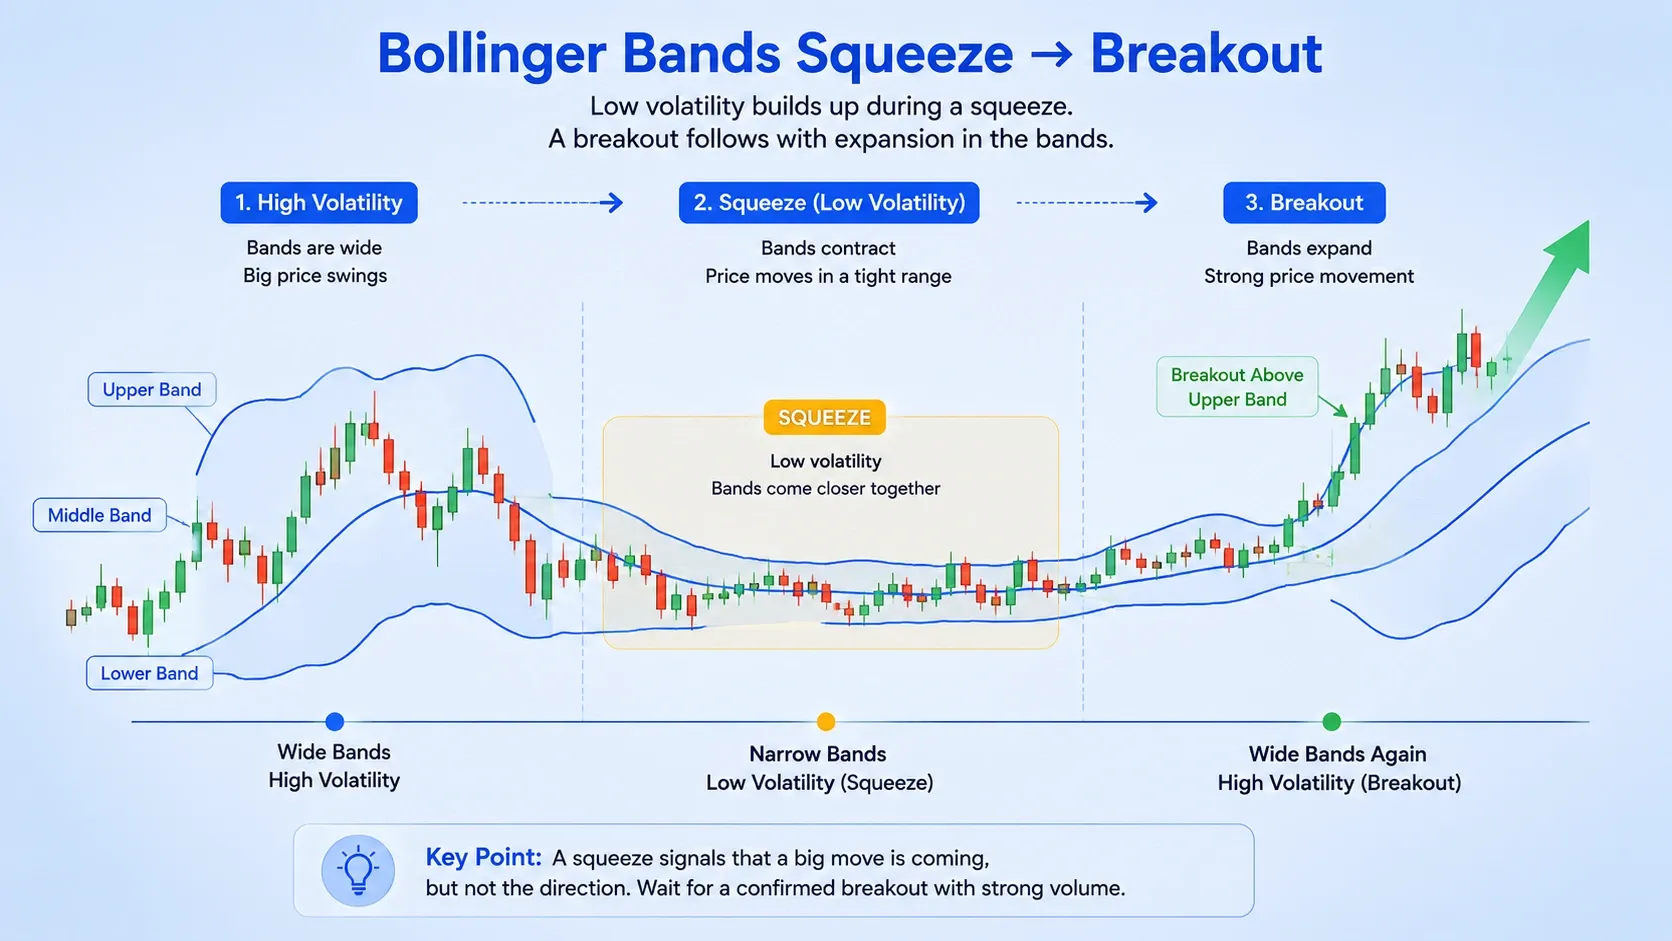
A breakout strategy involves entering a trade once price closes decisively outside one of the bands after a period of compression.
Basic breakout rules:
Volume confirmation matters more than most beginners realize. A breakout on thin trading volume is far less reliable than one accompanied by a clear volume spike, since low-volume breakouts are more likely to be false moves that reverse quickly. Many traders also set a stop-loss just inside the squeeze range, on the opposite side of their entry, to limit losses if the breakout turns out to be a fakeout.
The bounce strategy is the mean-reversion approach mentioned earlier, and it works best specifically in sideways or consolidating markets rather than trending ones.
Basic bounce rules:
This approach has historically worked well on large-cap Indian stocks during consolidation phases, where price repeatedly oscillates between the bands without breaking out in either direction for weeks at a time. Combining Bollinger Bands with existing support and resistance zones on the chart tends to improve the reliability of bounce entries, since a lower band touch that also coincides with a known support level carries more weight than the band alone.
Bollinger Bands are not limited to directional equity trades. For Indian F&O traders, the width of the bands itself is useful information for options strategies, since band width reflects expected volatility.
When the bands are squeezed tight, implied volatility is often low, which can make buying options relatively cheaper ahead of an expected volatility expansion. When the bands are already wide, implied volatility tends to be elevated, which can favor volatility-selling strategies like straddles or strangles, especially around events like quarterly earnings or Nifty/Bank Nifty expiry weeks. Cross-checking band width against India VIX, which tracks expected market volatility separately, gives options traders a second confirmation before committing to a volatility-based strategy. Traders combining Bollinger Bands with option Greeks and open interest data often get a fuller picture of both direction and volatility expectations before placing a trade.
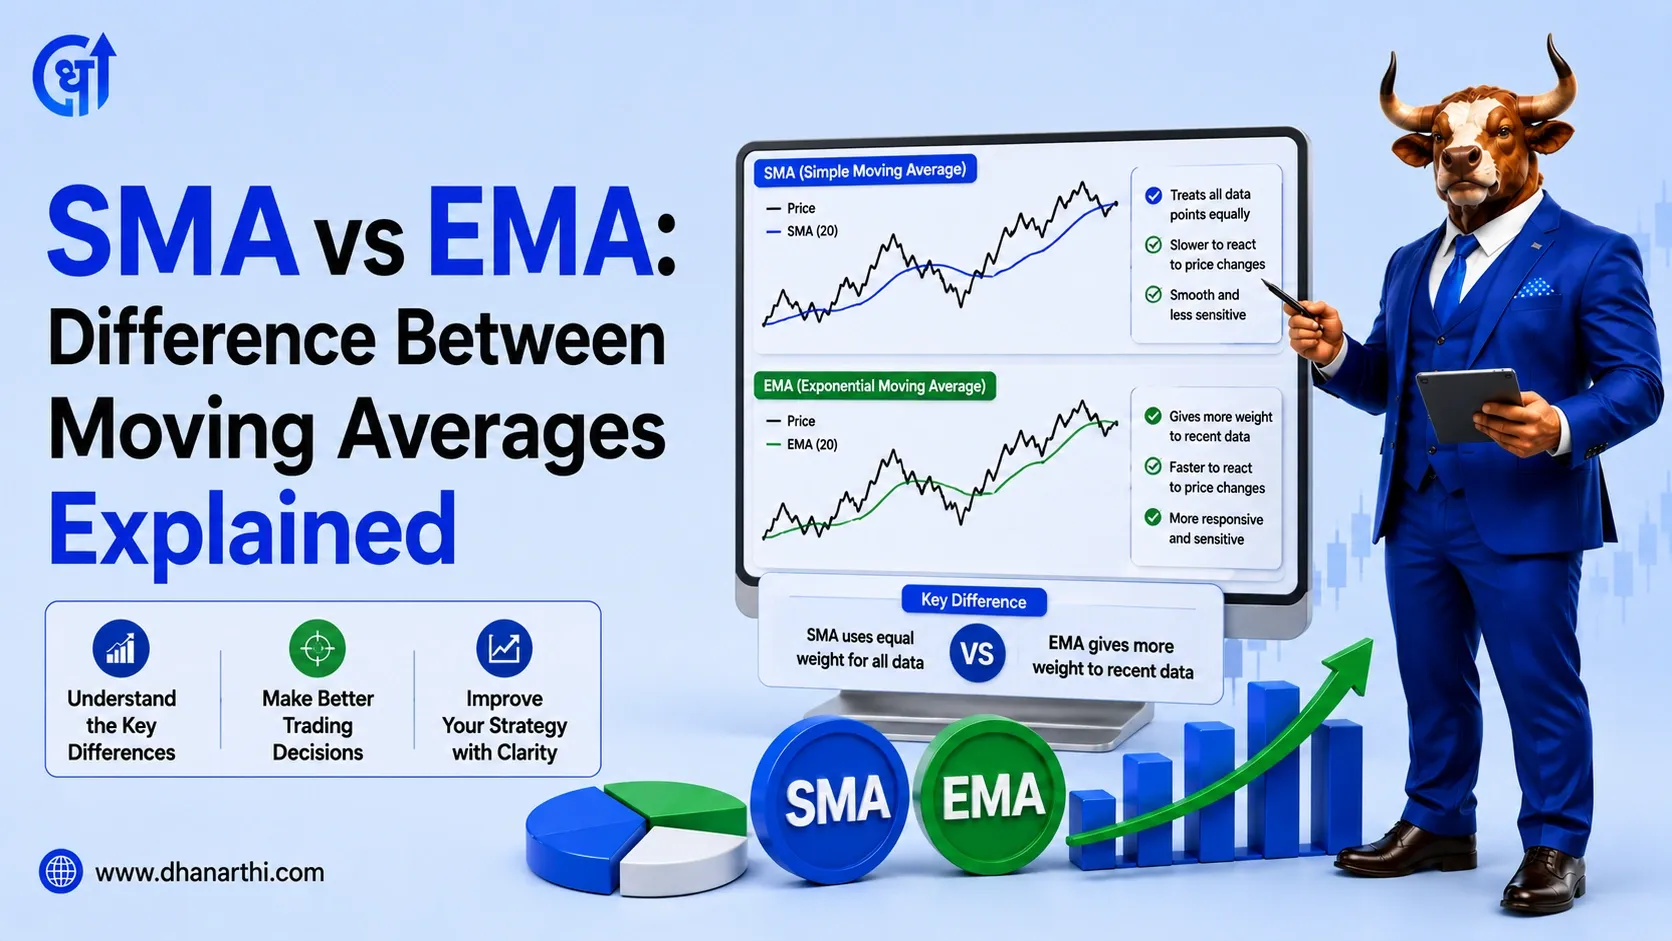
Bollinger Bands are not a standalone concept, they are built directly on top of a moving average. The middle band is simply a 20-period SMA, the same type of moving average used independently by trend-following traders. The upper and lower bands are just that same SMA adjusted for volatility using standard deviation.
This means Bollinger Bands essentially answer two questions at once: where is the trend (via the middle band), and how volatile is price around that trend (via the band width). Traders who already use moving averages for trend direction often find Bollinger Bands a natural extension, since the middle band gives the same trend information while the outer bands add a volatility layer on top.
Bollinger Bands are not flawless. Common limitations include:
A common mistake among beginner Indian traders is treating every breakout beyond the bands as tradeable without checking volume or confirming with a closed candle body, rather than just a brief wick outside the band. Bollinger Bands work better when combined with other tools like volume, RSI, or support and resistance levels rather than used in isolation.
For traders who want to cross-check a technically volatile or breakout setup against a company's underlying fundamentals before acting, comparing the move against the stock's recent quarterly results and broader fundamentals can help validate whether a Bollinger Bands breakout also has solid support behind it.
Bollinger Bands explained simply: they show where price sits relative to its recent average, and how volatile that price has been around it. The three most common strategies, bounce trading in range-bound markets, breakout trading after a squeeze, and using band width to gauge options volatility, each apply to different market conditions. The biggest mistake to avoid is treating every band touch as an automatic reversal signal, especially during strong trends, where price can ride one band for an extended period without reverting.
Disclaimer: This article is for educational purposes only. It does not constitute investment advice. Please consult a SEBI-registered financial advisor before making investment decisions.
1. What is Bollinger Bands indicator?
Bollinger Bands is a technical analysis indicator consisting of a middle band (20-period simple moving average) and an upper and lower band placed two standard deviations away, used to measure price volatility and identify potential trend or reversal signals.
2. What is the Bollinger Bands formula?
The middle band is a 20-period SMA. The upper band equals the middle band plus two standard deviations. The lower band equals the middle band minus two standard deviations.
3. How to use Bollinger Bands for trading?
Bollinger Bands can be used in three main ways: bounce trading in range-bound markets, breakout trading after a squeeze with volume confirmation, and gauging options volatility based on band width.
4. What is a Bollinger Bands squeeze?
A Bollinger Bands squeeze occurs when the upper and lower bands contract tightly toward the middle band, signaling low volatility that often precedes a significant price move. The squeeze does not indicate which direction the move will take.
5. Does price touching the upper Bollinger Band mean sell?
Not necessarily. In range-bound markets, price touching the upper band can suggest overbought conditions, but in strong uptrends, price can ride the upper band for many sessions without reversing.
6. What is the best Bollinger Bands strategy for Indian traders?
Many Indian traders use the squeeze breakout strategy on Nifty and Bank Nifty intraday charts, waiting for the bands to compress and then entering on a confirmed breakout candle with rising volume.
7. Can Bollinger Bands be used for options trading?
Yes, Bollinger Band width reflects expected volatility, which can help options traders decide between buying options ahead of a squeeze breakout or selling options like straddles and strangles when bands are already wide.
8. What is the difference between Bollinger Bands and moving averages?
The middle Bollinger Band is itself a simple moving average. Bollinger Bands add an upper and lower band based on standard deviation, giving both trend direction and volatility information in one indicator.
9. What are the default settings for Bollinger Bands?
The standard default setting is a 20-period simple moving average with bands placed two standard deviations away. Some traders use a 10-period setting for intraday trading or a 50-period setting for longer-term analysis.
10. Are Bollinger Bands reliable for intraday trading?
Bollinger Bands are commonly used for intraday trading, especially the squeeze breakout strategy on 5-minute and 15-minute charts, though signals should be confirmed with volume to avoid false breakouts.
11. What is a common mistake traders make with Bollinger Bands?
A common mistake is assuming every price touch at the upper or lower band means an automatic reversal, without checking whether the market is trending or range-bound, which can lead to losses in strongly trending conditions.
12. Can Bollinger Bands be combined with other indicators?
Yes, Bollinger Bands are often combined with RSI, MACD, or volume analysis for additional confirmation, since relying on Bollinger Bands alone can produce false signals, particularly in trending markets.
Share Market
IPO
Artificial Intelligence
Semi Conductor