



What is MACD Indicator? Meaning, Formula & Trading Signals
August 17, 2026



TABLE OF CONTENTS
Get AI Summary





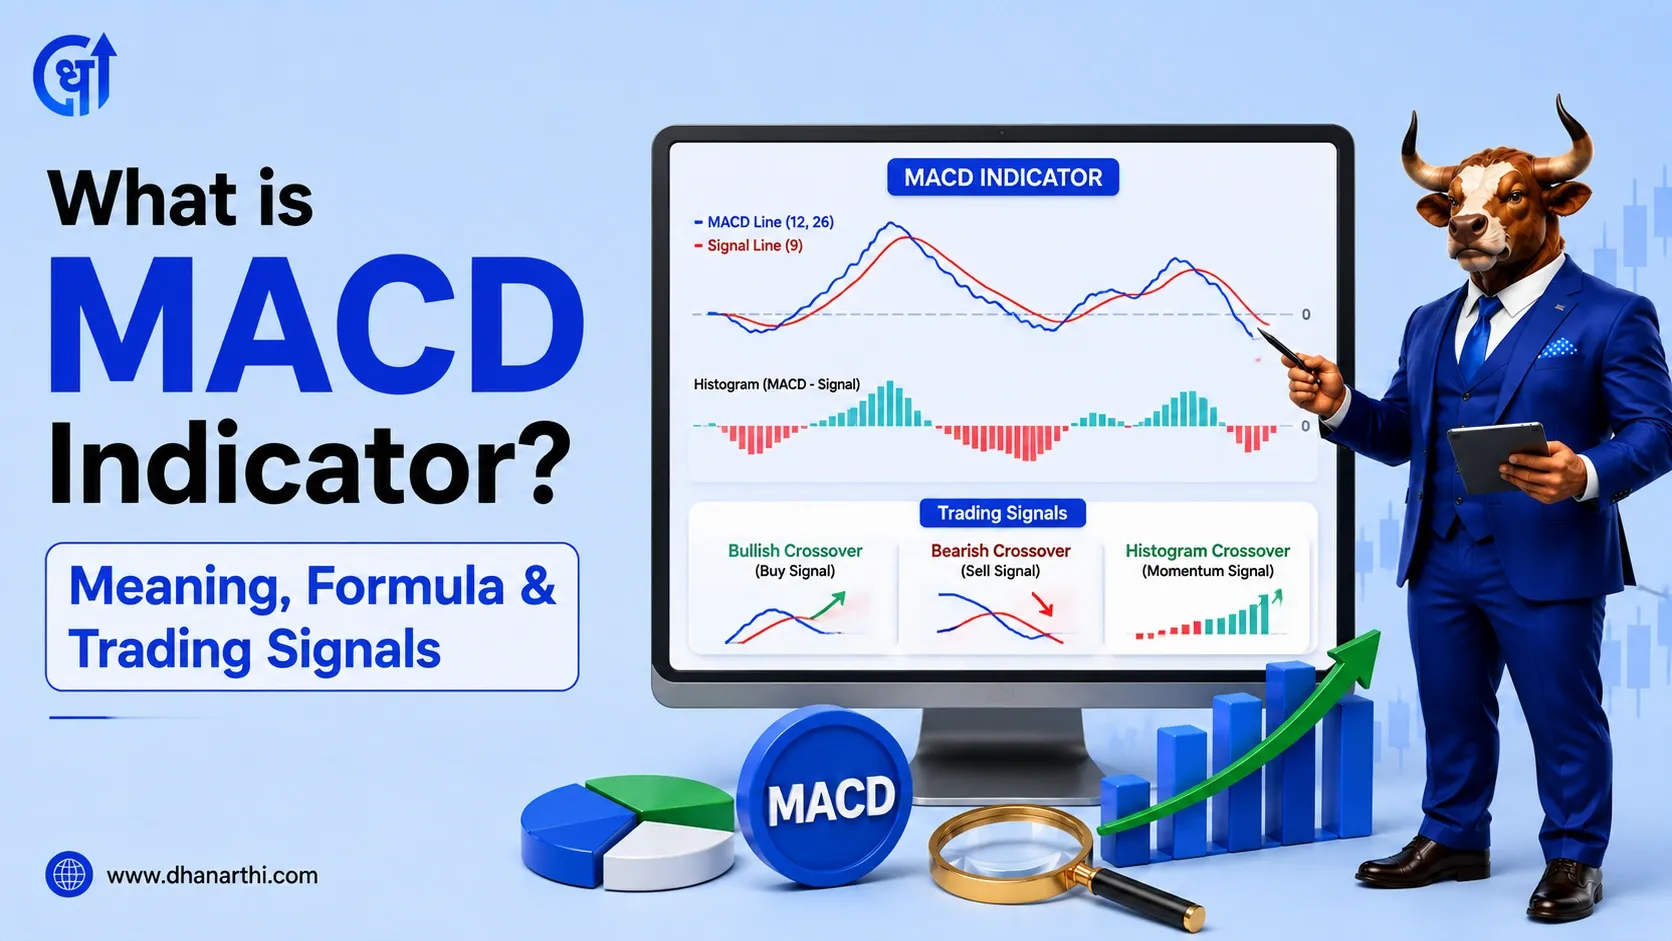
MACD (Moving Average Convergence Divergence) is a trend-following momentum indicator that shows the relationship between two exponential moving averages of a stock's price. Developed by Gerald Appel, MACD helps traders spot changes in trend direction, momentum strength, and potential buy or sell signals through crossovers, the zero line, and divergence.
MACD full form is Moving Average Convergence Divergence, a trend and momentum indicator built from EMAs
MACD formula: MACD Line = 12-period EMA minus 26-period EMA, Signal Line = 9-period EMA of the MACD line
A bullish crossover happens when the MACD line crosses above the signal line, a bearish crossover when it crosses below
Unlike RSI, MACD has no fixed 0-100 range, so it works differently for spotting overbought or oversold conditions - see the RSI guide for that comparison
MACD zero line crossovers confirm a longer-term trend shift, while signal line crossovers show shorter-term momentum changes
MACD divergence between price and the indicator can warn of a weakening trend before price confirms it
MACD works best combined with volume, support/resistance, or other indicators, not used alone
MACD stands for Moving Average Convergence Divergence. It is a trend-following momentum indicator developed by Gerald Appel that compares two exponential moving averages, or EMAs, to show how short-term price momentum is behaving relative to longer-term momentum.
MACD in stock market terms answers two questions at once: which direction is the trend moving, and is that trend gaining or losing strength? This dual nature makes MACD indicator explained differently from a pure oscillator like RSI, since MACD has no fixed upper or lower boundary. Most Indian traders view MACD on platforms like Zerodha Kite, TradingView, or Upstox Pro alongside price charts for Nifty, Bank Nifty, and individual stocks.
MACD full form in stock market is Moving Average Convergence Divergence. The name describes exactly what the indicator tracks: how two moving averages converge toward each other and diverge away from each other over time.
When the shorter-term EMA moves further away from the longer-term EMA, momentum is strengthening. When the two EMAs move closer together, momentum is fading. This convergence and divergence between the averages is what the MACD indicator plots as a single line.
MACD indicator is built from three components:
| Component | Formula | What It Shows |
|---|---|---|
| MACD Line | 12-period EMA minus 26-period EMA | How far short-term momentum has moved from long-term momentum |
| Signal Line | 9-period EMA of the MACD line | A smoothed trigger line used to generate crossover signals |
| Histogram | MACD Line minus Signal Line | Visual representation of momentum strength, expanding or shrinking |
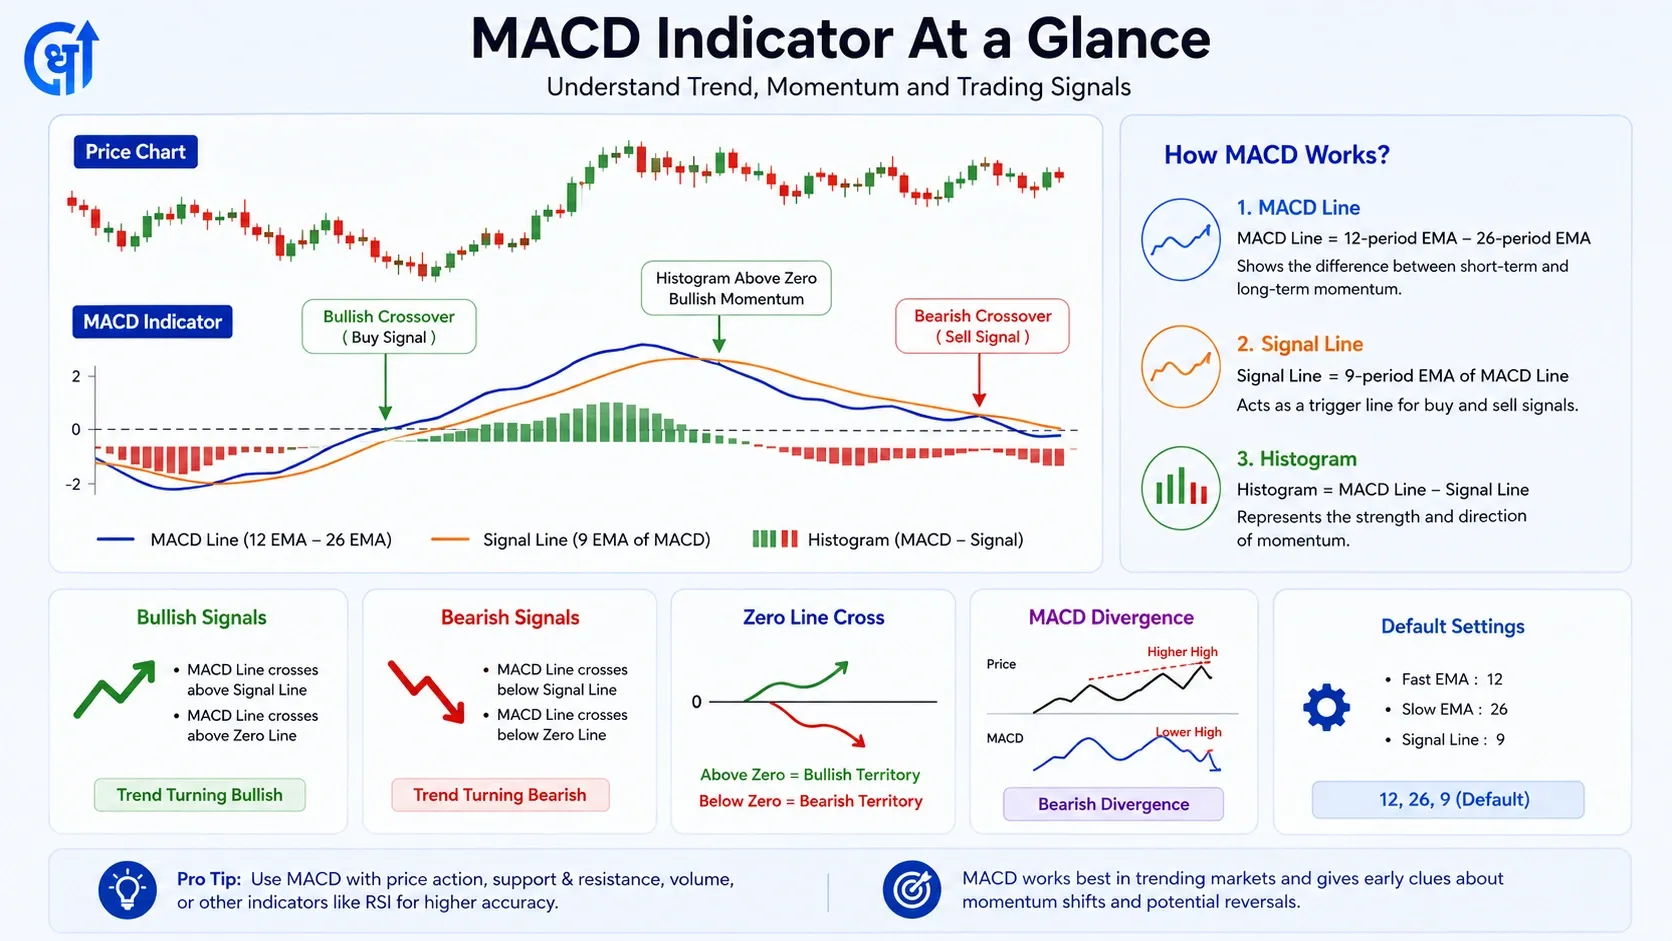
Worked example: If the 12-period EMA of a stock is Rs 1,050 and the 26-period EMA is Rs 1,020, the MACD line = 1,050 - 1,020 = 30. If the signal line (9-period EMA of the MACD line) is at 22, the histogram = 30 - 22 = 8, a positive reading showing bullish momentum is building.
Most Indian brokerage platforms calculate all three components automatically. You do not need to compute EMAs manually while trading live.
The most commonly used MACD indicator how to use approach is watching for crossovers between the MACD line and the signal line.
| Crossover Type | What Happens | Signal |
|---|---|---|
| Bullish crossover | MACD line crosses above signal line | Possible buy opportunity, momentum turning positive |
| Bearish crossover | MACD line crosses below signal line | Possible sell signal, momentum turning negative |
A bullish crossover does not guarantee a rally, and a bearish crossover does not guarantee a fall. In sideways or choppy markets, MACD crossovers can produce frequent false signals, so confirmation with price action or volume matters.
Many beginners confuse the signal-line crossover with the zero-line crossover, but they mean different things.
A zero line crossover happens when the MACD line itself crosses above or below zero. When MACD crosses above zero, it confirms the 12-period EMA has moved above the 26-period EMA, meaning the short-term trend has genuinely shifted above the long-term trend, not just that momentum improved temporarily. When MACD crosses below zero, the opposite is true.
On daily charts of Nifty 50 stocks, a MACD zero line crossover from negative to positive territory, especially when accompanied by rising volume, is generally treated as a more reliable trend-confirmation signal than a signal-line crossover alone, since it reflects an actual shift in the underlying moving averages rather than a short-term wiggle.
MACD divergence occurs when price and the MACD indicator move in opposite directions, signaling that the current trend may be losing strength.
Bullish divergence: Price makes a new low, but MACD forms a higher low. This suggests the downtrend is weakening even though price is still falling.
Bearish divergence: Price makes a new high, but MACD forms a lower high. This suggests the uptrend is losing strength even though price is still rising.
Indian index traders often watch MACD divergence on Nifty and Bank Nifty charts during extended rallies or sell-offs, since divergence can hint at a turning point before price itself confirms the reversal.
The default 12, 26, 9 setting is the most widely used MACD configuration and works well for daily charts on Nifty, Bank Nifty, and individual stocks. For intraday trading, some traders use faster settings to reduce lag, though this comes with more false signals.
| Setting | Best For | Trade-off |
|---|---|---|
| 12, 26, 9 (default) | Daily and swing trading | Standard, well-tested, moderate lag |
| 8, 17, 9 | Faster intraday signals | More signals, more noise |
| 5, 13, 1 | Scalping on very short timeframes | Fastest response, highest false-signal rate |
Before switching to faster settings, it is worth backtesting on the specific stock and timeframe being traded, since no single setting works best across all market conditions.
MACD and RSI are both momentum indicators, but they measure different things. MACD shows trend direction and momentum strength using moving averages, while RSI shows overbought and oversold conditions on a fixed 0 to 100 scale.
Many Indian traders use both together: RSI to identify when a stock may be overextended, and MACD to confirm whether the broader trend actually supports a reversal or continuation. Screening stocks that show favorable readings on both indicators together is easier with a tool like the Dhanarthi Stock Screener, which lets traders filter by multiple technical parameters at once.
MACD is not flawless. Common limitations include:
MACD is a lagging indicator, since it is built from moving averages of past price data
MACD crossovers produce frequent false signals in sideways or range-bound markets
MACD does not account for trading volume on its own, which can lead to misleading signals on low-volume stocks
A common mistake among beginner Indian traders is acting on every MACD crossover without checking the broader trend, support and resistance zones, or volume confirmation. MACD works better when combined with price action, RSI, or basic candlestick pattern confirmation rather than used in isolation.
For traders who want to cross-check technical signals like MACD against a company's underlying fundamentals before acting, the Dhanarthi AI Financial Research Assistant can help validate whether a technically bullish or bearish stock also has strong or weak fundamentals.
MACD indicator explained simply: it tracks how two moving averages of different speeds move toward and away from each other, giving traders a single line to judge trend direction and momentum strength. Crossovers, the zero line, and divergence each tell a slightly different story, and MACD works best when read alongside price action, volume, and other indicators like RSI rather than used alone.
Disclaimer: This article is for educational purposes only. It does not constitute investment advice. Please consult a SEBI-registered financial advisor before making investment decisions.
1. What is MACD in stock market?
MACD, or Moving Average Convergence Divergence, is a trend-following momentum indicator that compares two exponential moving averages of a stock's price to show trend direction and momentum strength.
2. What is MACD full form in stock market?
MACD full form in stock market is Moving Average Convergence Divergence. It was developed by Gerald Appel and is one of the most widely used momentum indicators globally.
3. How to use MACD indicator for trading?
Traders use MACD indicator by watching for crossovers between the MACD line and signal line, zero line crossovers for trend confirmation, and divergence between price and MACD for early reversal signals.
4. What is the MACD line and signal line?
The MACD line is the difference between the 12-period and 26-period EMA. The signal line is a 9-period EMA of the MACD line, used as a trigger for crossover signals.
5. What does the MACD histogram mean?
The MACD histogram shows the difference between the MACD line and the signal line. A growing histogram means momentum is increasing, while a shrinking histogram means momentum is fading.
6. What is a MACD buy and sell signal?
A buy signal is generally considered to occur when the MACD line crosses above the signal line, called a bullish crossover. A sell signal occurs when the MACD line crosses below the signal line, called a bearish crossover.
7. What is MACD zero line crossover?
A MACD zero line crossover happens when the MACD line itself crosses above or below zero, confirming that the short-term EMA has genuinely moved above or below the long-term EMA, signaling a stronger trend shift than a signal-line crossover alone.
8. What is MACD divergence with an example?
MACD divergence occurs when price and MACD move in opposite directions. For example, if a stock makes a new high but MACD forms a lower high, this bearish divergence suggests the uptrend may be losing strength.
9. What are the best MACD settings for intraday trading in India?
The default 12, 26, 9 setting works for most traders, but some intraday traders use faster settings like 8, 17, 9 for quicker signals, accepting more false signals in exchange for reduced lag.
10. Is MACD better than RSI, or should both be used together?
MACD and RSI measure different things: MACD shows trend and momentum direction, while RSI shows overbought and oversold levels. Many traders use both together rather than choosing one over the other.
11. Can MACD be used alone for trading decisions?
MACD works best when combined with other tools like RSI, volume, or support and resistance levels. Using MACD alone can lead to false signals, especially in sideways or range-bound markets.
12. Is MACD indicator good for beginners?
Yes, MACD is considered one of the more beginner-friendly indicators because its crossover signals and histogram are visually simple to read, though understanding its limitations takes practice.
Share Market
IPO
Artificial Intelligence
Semi Conductor