
SMA vs EMA: Difference Between Moving Averages Explained
August 18, 2026



TABLE OF CONTENTS
Get AI Summary





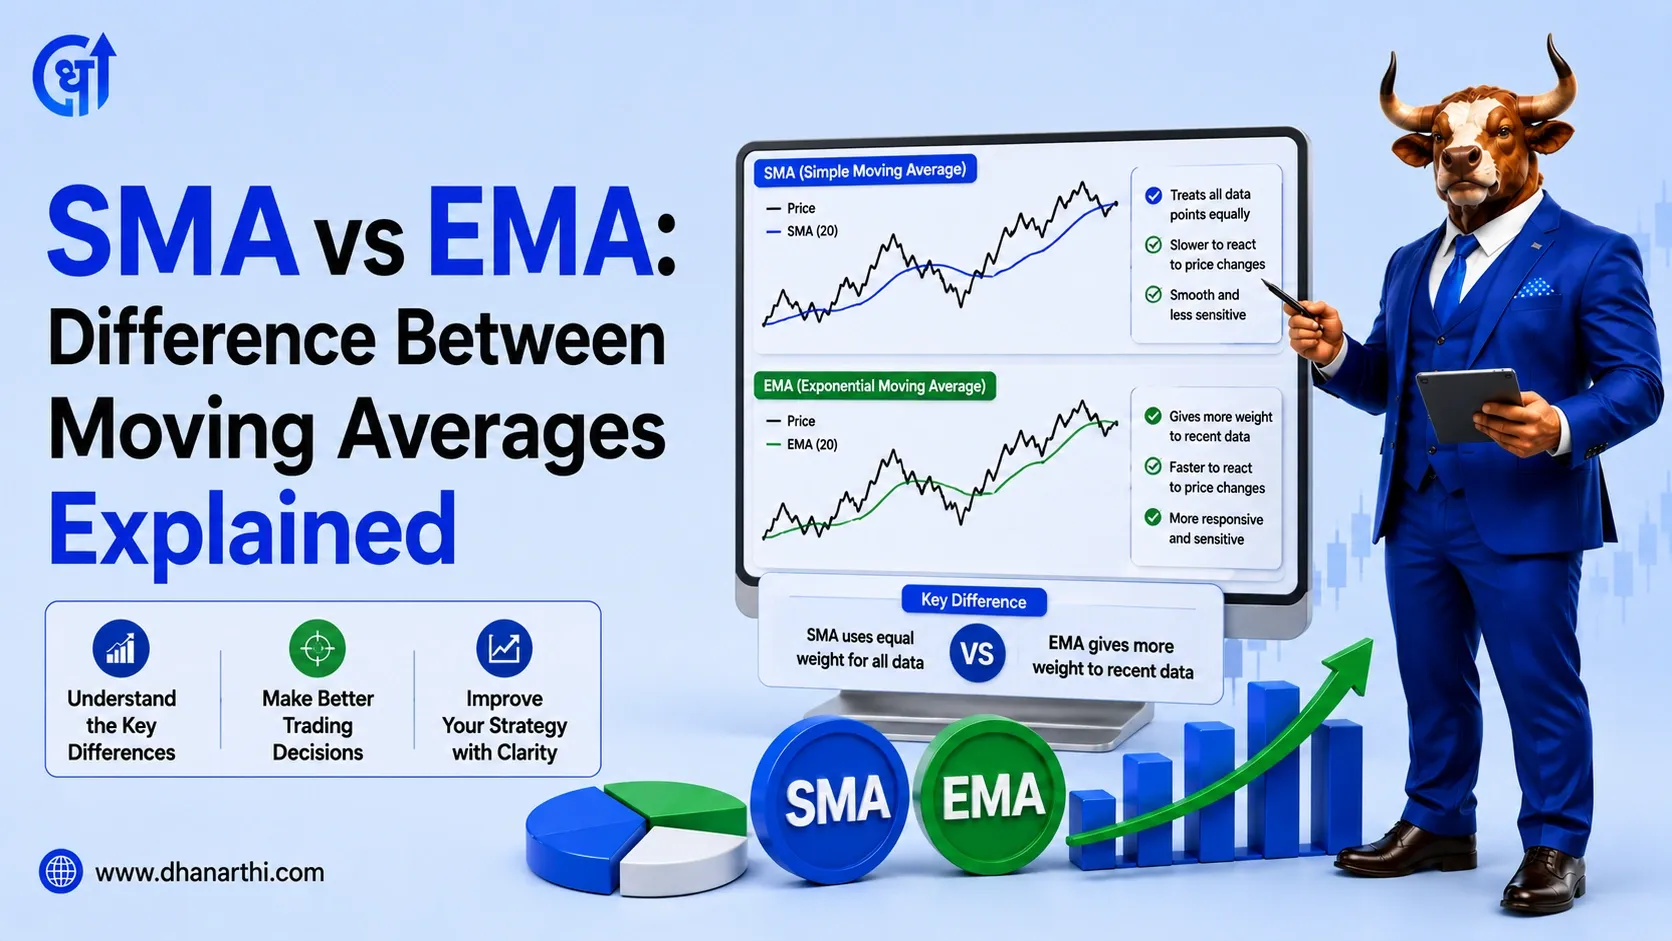
SMA (Simple Moving Average) and EMA (Exponential Moving Average) are the two most common types of moving averages used in technical analysis. SMA gives equal weight to every price in the period, making it smoother and slower to react. EMA gives more weight to recent prices, making it faster to respond to new trends. Both are used to identify trend direction, support and resistance, and crossover trading signals.
A moving average smooths out price data by calculating the average price of a stock over a specific number of periods, then plotting that average as a single line on the chart. As new price data comes in, the oldest data point drops off and the average moves forward, which is why it is called a "moving" average.
Moving averages do not predict future price movement. They confirm trends. When price stays above a rising moving average, the trend is considered bullish. When price stays below a falling moving average, the trend is considered bearish. Because they are built from past price data, all moving averages lag behind the current price to some degree.
Simple Moving Average, or SMA, calculates the average closing price of a stock over a chosen number of periods, with every price in that period weighted equally.
SMA Formula: SMA = (Sum of closing prices over N periods) / N
Worked example: For a 10-day SMA, add the closing prices of the last 10 trading days and divide by 10. If a stock closed at prices totaling Rs 10,500 over 10 days, the 10-day SMA = 10,500 / 10 = Rs 1,050.
Because SMA gives equal weight to all data points, it reacts slowly to sudden price changes. This makes SMA smoother and more reliable for spotting long-term trend direction, but slower to signal a genuine trend reversal.
Exponential Moving Average, or EMA, is a more responsive version of the moving average that gives greater weight to recent prices while still factoring in older data with progressively less influence.
EMA Formula (simplified): EMA = (Closing Price x Multiplier) + (Previous EMA x (1 - Multiplier)), where Multiplier = 2 / (N + 1)
The first EMA value typically starts from the SMA of the same period, and each new calculation blends in the latest closing price with greater weight than older prices.
Worked example: If a stock's previous 10-day EMA was Rs 1,048 and today's closing price is Rs 1,070, the EMA will move up, but only partway toward the new close, since the multiplier blends new and old data rather than replacing it outright. This partial adjustment is what makes EMA faster than SMA but still smoothed.
| Factor | SMA | EMA |
|---|---|---|
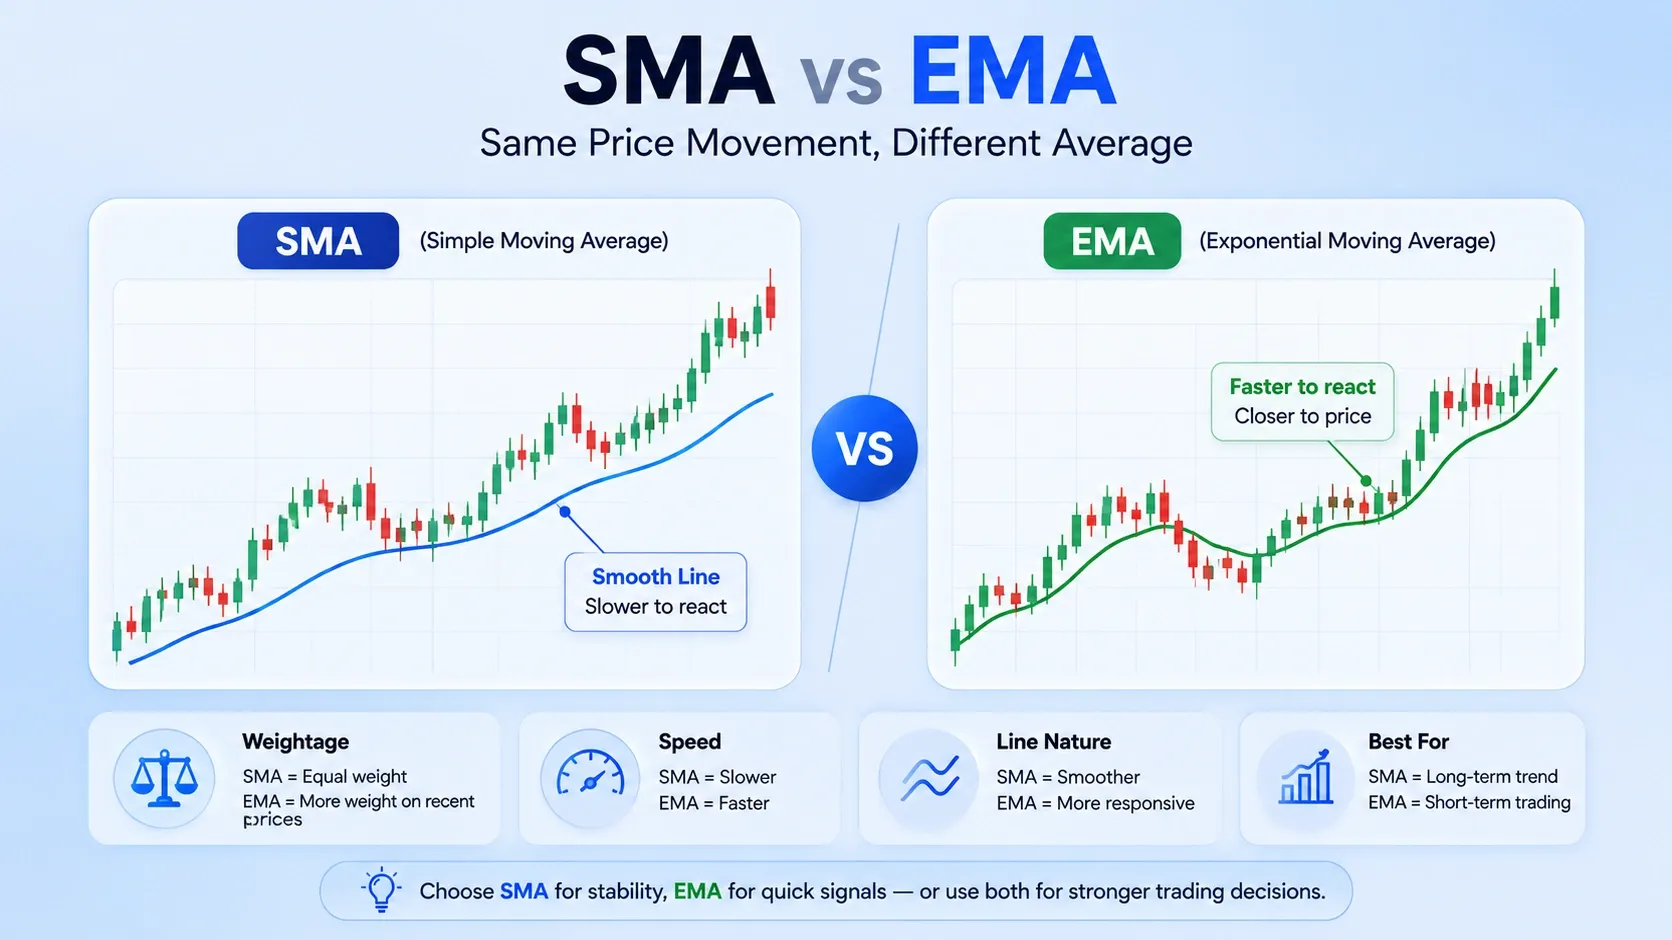
| Weighting | Equal weight to all prices | More weight to recent prices |
| Speed of reaction | Slower, more lag | Faster, less lag |
| Smoothness | Smoother, fewer false signals | More sensitive to price noise |
| Best suited for | Long-term trend confirmation, positional trading | Short-term momentum, intraday and swing trading |
| Common use | 50-day SMA, 200-day SMA | 9 EMA, 12 EMA, 26 EMA (used in MACD) |
Neither SMA nor EMA is universally "better." The right choice depends on whether a trader values stability (SMA) or responsiveness (EMA) more for their specific strategy.
A moving average crossover occurs when a shorter-period moving average crosses above or below a longer-period moving average, signaling a potential shift in trend.
| Crossover | What Happens | Signal |
|---|---|---|
| Golden Cross | Short-term average (e.g., 50-day) crosses above long-term average (e.g., 200-day) | Bullish, potential start of an uptrend |
| Death Cross | Short-term average crosses below long-term average | Bearish, potential start of a downtrend |
On Nifty 50 and Bank Nifty daily charts, the 50-day and 200-day SMA crossover is one of the most closely watched signals among Indian positional traders, since it reflects a genuine shift in the broader trend rather than short-term noise. That said, crossovers are lagging signals by nature, they confirm a trend after it has already begun rather than predicting it in advance.
The moving average period should match the trading timeframe being used. A long-period average on a very short chart adds little value, and a short-period average on a daily chart reacts to noise rather than trend.
| Trading Style | Suggested Averages | Why |
|---|---|---|
| Intraday (5-min chart) | 9 EMA, 21 EMA | Fast enough to react within the trading session |
| Swing trading (daily chart) | 21 EMA, 50 SMA | Balances responsiveness with trend reliability |
| Positional/long-term | 50 SMA, 200 SMA | Smooths short-term noise, confirms major trend shifts |
A useful principle: limit charts to two or three moving averages that each serve a distinct purpose, such as one for short-term momentum, one for the intermediate trend, and one for the long-term trend, rather than cluttering the chart with too many overlapping lines.
Many experienced traders do not choose one over the other, they combine both. A common approach treats the longer SMA as a filter and a shorter EMA as a trigger.
Example workflow:
This combination gives traders the stability of a long-term filter alongside the responsiveness of a short-term trigger, rather than relying on a single moving average for both trend confirmation and entry timing.
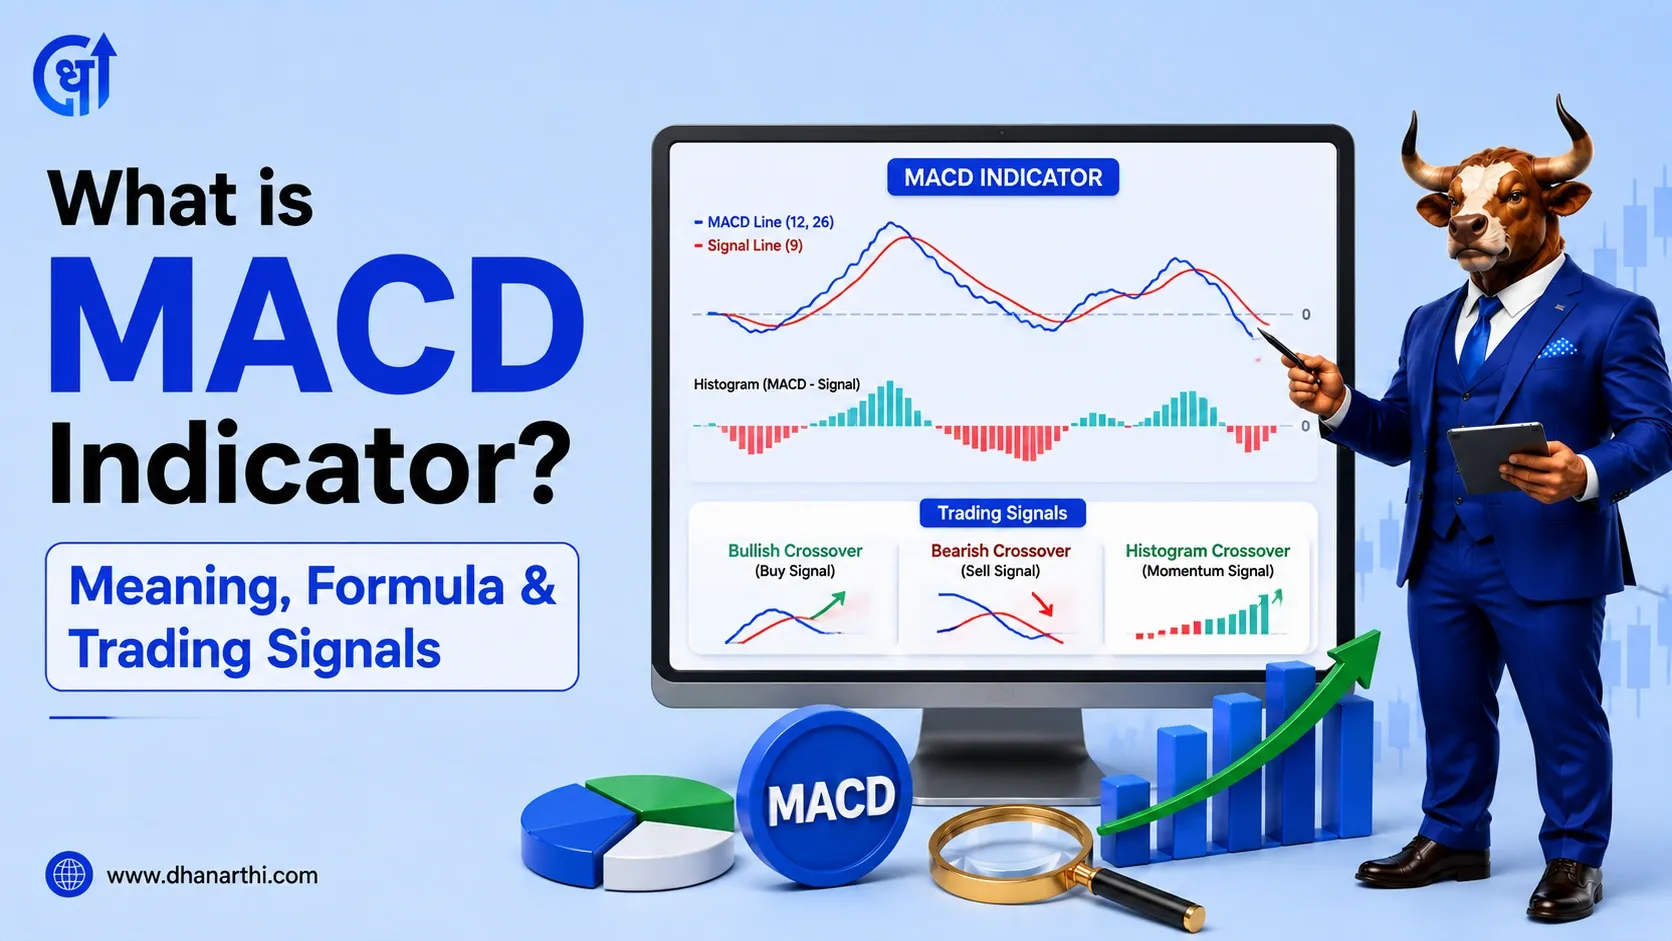
Moving averages are trend-following tools, while indicators like RSI and MACD are momentum tools. In fact, MACD itself is built directly from EMAs, the MACD line is the difference between a 12-period and 26-period EMA, which shows how closely these concepts are related.
A common approach among Indian retail traders is to use a moving average to confirm the overall trend direction, then use RSI or MACD to time entries and exits within that trend, rather than relying on any single tool in isolation.
Moving averages are not flawless. Common limitations include:
A common mistake among beginner Indian traders is treating every moving average crossover as an automatic buy or sell signal without checking the slope of the average itself or confirming with volume and price action. A flat moving average is not the same as a rising or falling one, and the difference matters more than the crossover alone.
For traders who want to validate a technically strong setup against a company's underlying fundamentals before acting, the Dhanarthi AI Financial Research Assistant can help cross-check whether a stock trending above its moving averages also has solid fundamentals behind it.
SMA vs EMA comes down to a simple trade-off: SMA offers smoothness and reliability for long-term trend confirmation, while EMA offers speed and responsiveness for short-term momentum. Neither is strictly better, the right moving average, and the right period, depends on the trader's timeframe and strategy. Many traders get the best of both by combining a longer SMA as a trend filter with a shorter EMA as an entry trigger.
Disclaimer: This article is for educational purposes only. It does not constitute investment advice. Please consult a SEBI-registered financial advisor before making investment decisions.
1. What is the difference between EMA and SMA?
SMA gives equal weight to all prices in the period, making it smoother but slower to react. EMA gives more weight to recent prices, making it faster to respond to new trends but more sensitive to price noise.
2. What is a moving average in stock market?
A moving average is a technical indicator that smooths out price data by calculating the average price over a chosen number of periods, helping traders identify trend direction.
3. What is SMA vs EMA and which one should I use?
SMA is better suited for long-term trend confirmation and positional trading due to its smoothness. EMA is better suited for short-term or intraday trading due to its faster response to price changes. Many traders use both together.
4. What does day moving average meaning refer to?
Day moving average meaning refers to a moving average calculated over a specific number of trading days, such as a 50-day or 200-day moving average, used to track trend direction over that period.
5. What is exponential moving average used for?
Exponential moving average is used to identify short-term trend direction and momentum more quickly than a simple moving average, since it weighs recent prices more heavily. It is also a core component of indicators like MACD.
6. What is a Golden Cross and Death Cross?
A Golden Cross occurs when a short-term moving average crosses above a long-term moving average, considered bullish. A Death Cross occurs when a short-term average crosses below a long-term average, considered bearish.
7. Which moving average is best for intraday trading in India?
Shorter EMAs, such as the 9 EMA and 21 EMA, are commonly used for intraday trading since they react faster to short-term price movements compared to longer SMAs.
8. Can moving average and exponential moving average be used together?
Yes, many traders combine a longer SMA as a trend filter with a shorter EMA as an entry trigger, using the SMA to confirm the broader trend and the EMA to time entries within that trend.
9. Is the 200-day SMA important for Indian stocks?
Yes, the 200-day SMA is widely watched by Indian positional traders and investors as a key indicator of the long-term trend, with price crossing above or below it often treated as a significant signal.
10. What is the average of moving average calculation based on?
A moving average is based on the average of a stock's closing prices over a chosen number of periods, recalculated continuously as new price data replaces the oldest data point in the period.
11. Do moving averages work in sideways markets?
Moving averages tend to generate frequent false signals in sideways or range-bound markets, since price can whipsaw across the average repeatedly without a clear trend forming.
12. How many moving averages should I use on a chart?
Most traders limit themselves to two or three moving averages, each serving a distinct purpose such as short-term momentum, intermediate trend, and long-term trend, to avoid conflicting or cluttered signals.
Share Market
IPO
Artificial Intelligence
Semi Conductor