


Chart Patterns Guide: Head & Shoulders, Triangles, Flags
August 20, 2026



TABLE OF CONTENTS
Get AI Summary





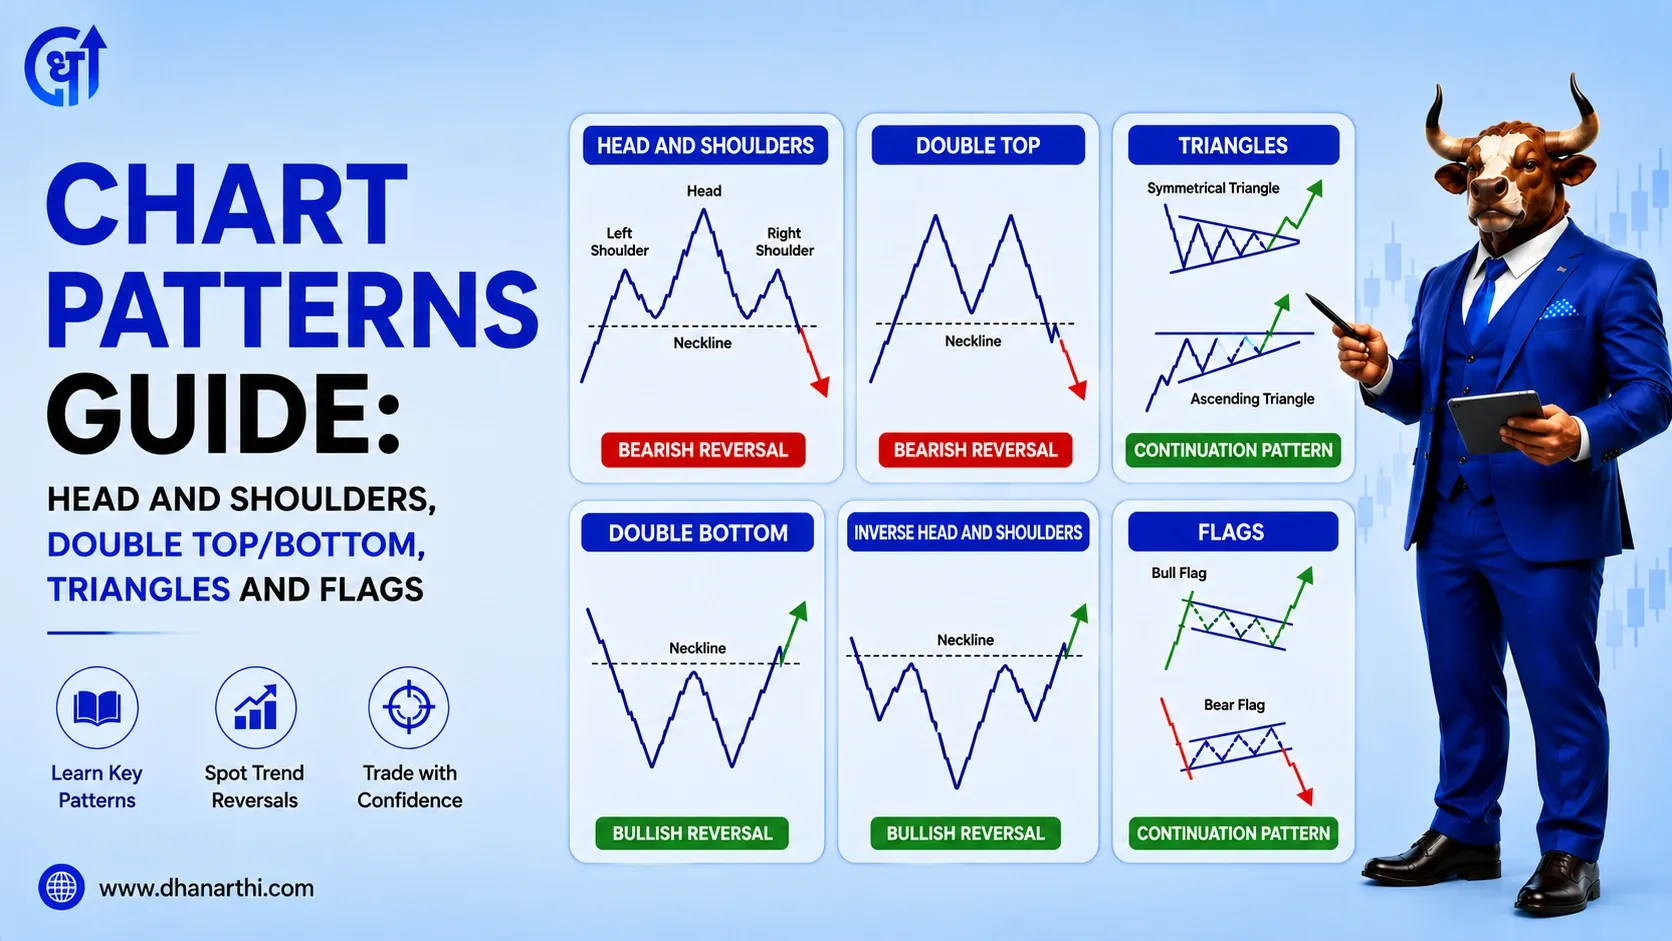
Chart patterns are recurring price shapes on a stock chart that reflect the ongoing battle between buyers and sellers. The most widely used patterns, head and shoulders, double top/bottom, triangles, and flags, help traders identify potential trend reversals or continuations before they fully play out, though they work best when confirmed with volume and other indicators.
Chart patterns are visual formations that appear on a price chart when a stock's price action repeats certain recognizable shapes over time. These shapes are not random, they reflect genuine shifts in buying and selling pressure that tend to repeat across different stocks and market cycles because trader psychology repeats.
Chart pattern trading in the modern form traces back to the 1930s and 1940s, when technical analysts first began documenting recurring price shapes like head and shoulders and triangles on paper charts. Today, the same patterns show up across NSE and BSE stocks, indices like Nifty and Bank Nifty, and timeframes ranging from 5-minute intraday charts to weekly charts.
Patterns generally fall into two categories. Reversal patterns signal that an existing trend is likely ending. Continuation patterns signal that a pause in the trend is likely to resolve back in the same direction. Patterns formed on daily or weekly charts tend to be more reliable than those on very short timeframes, since they reflect stronger overall market participation.
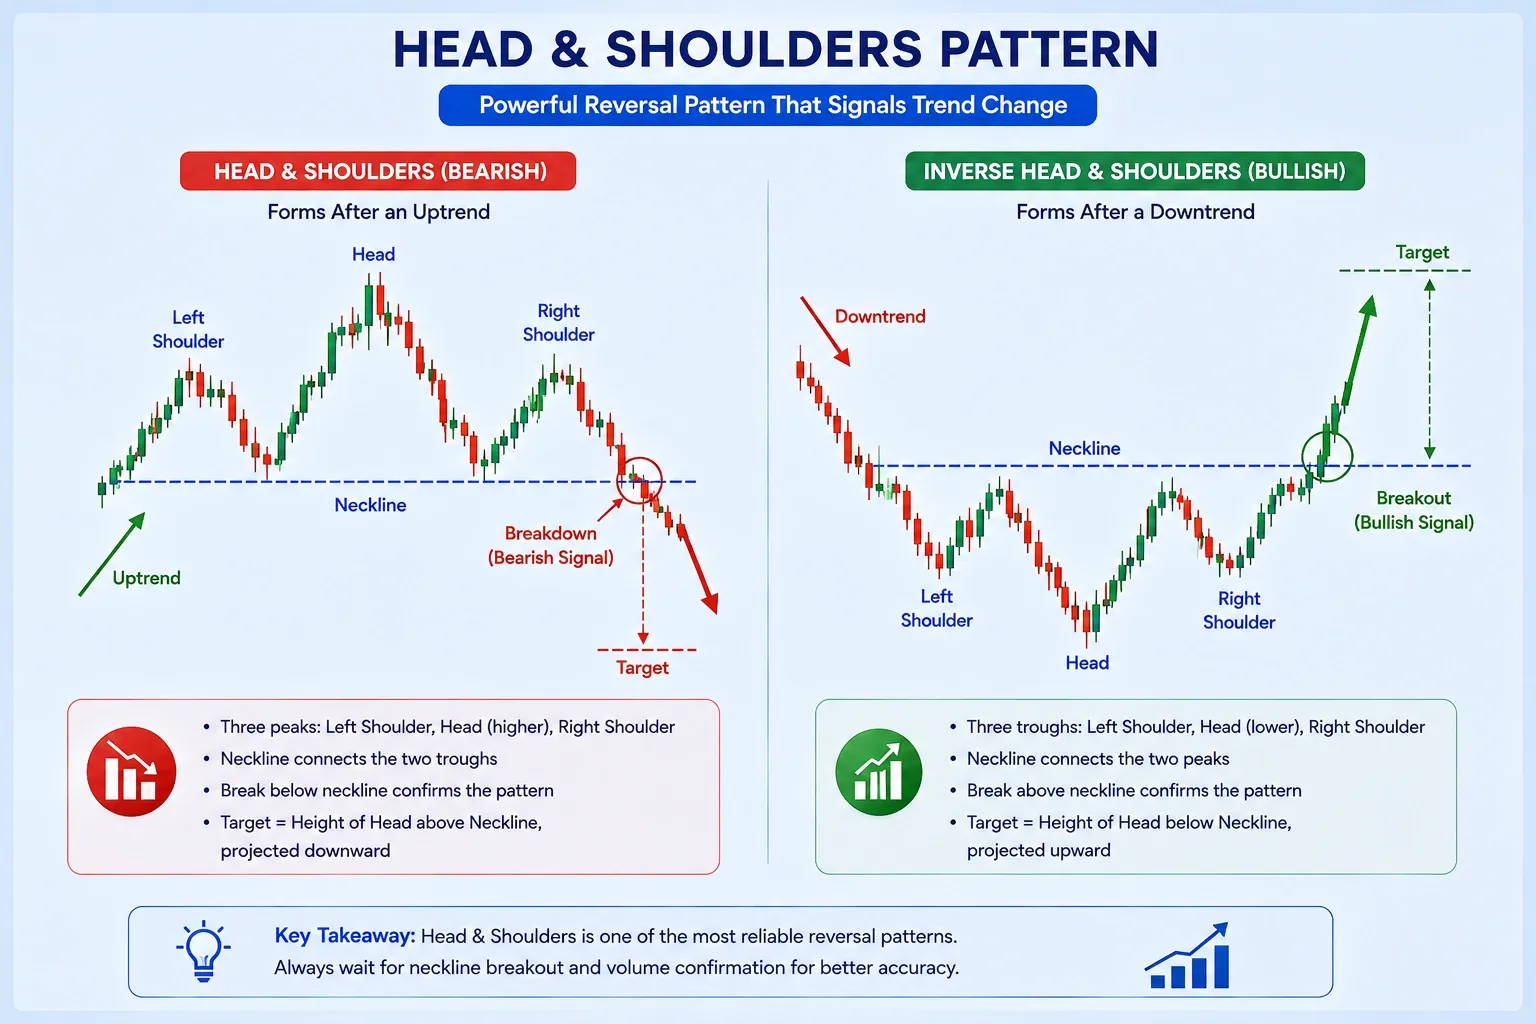
The head and shoulders pattern is a bearish reversal pattern that forms after an uptrend and signals the trend may be ending. It is built from three peaks: a left shoulder, a higher head in the middle, and a right shoulder that fails to exceed the head's height. A line connecting the two troughs between these peaks forms the neckline.
How it forms:
Target calculation: Neckline level minus the height of the head above the neckline, projected downward from the breakout point.
Around mid-2024, Reliance Industries formed a structure resembling a head and shoulders top near the Rs 2,900 zone, with price breaking below the Rs 2,800 neckline area and drifting toward roughly Rs 2,700 in the following sessions (Source: NSE historical price data). This illustrates how the pattern's neckline break can precede a measurable short-term move once confirmed.
The inverse head and shoulders is the bullish mirror image of the standard pattern, forming at the bottom of a downtrend rather than the top of an uptrend.
It consists of a left shoulder (a low), a lower head in the middle, and a right shoulder that fails to break below the head. The neckline connects the two peaks between these troughs. A confirmed break above the neckline signals a potential bullish reversal, with the target calculated the same way, the height of the head projected upward from the breakout point.
Like its bearish counterpart, this pattern is considered more reliable on daily or weekly charts than on very short intraday timeframes, since it requires genuine accumulation by buyers rather than short-term noise.
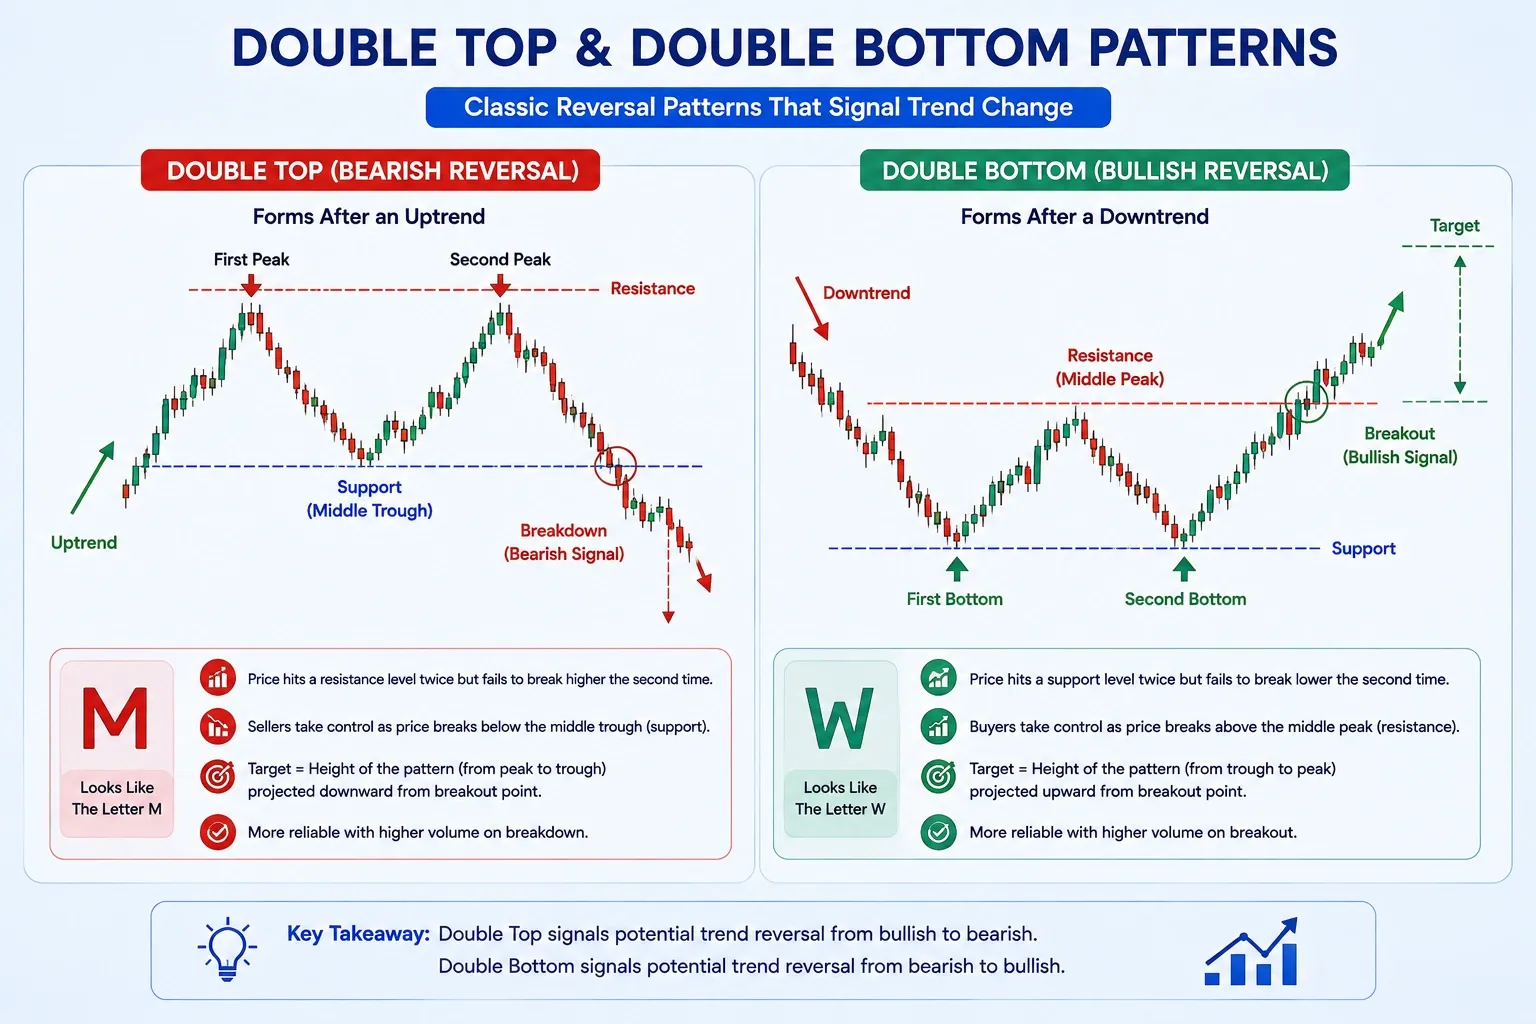
A double top forms after an uptrend when price tests a resistance level, pulls back, rises to test the same level again, and fails to break through a second time. Visually, it resembles the letter "M." The pattern confirms only when price breaks below the support level between the two peaks, known as the middle trough.
A double bottom is the bullish mirror image, resembling the letter "W." Price tests a support level twice, fails to break lower both times, then breaks above the resistance level between the two troughs.
Target calculation: The height of the pattern, measured from the peaks/troughs to the middle trough/peak, projected in the direction of the breakout.
| Pattern | Shape | Forms After | Confirms When | Signal |
|---|---|---|---|---|
| Double Top | M | Uptrend | Price breaks below middle trough | Bearish |
| Double Bottom | W | Downtrend | Price breaks above middle peak | Bullish |
Both patterns are considered high-reliability setups precisely because price failed to break a key level twice before reversing, giving traders a clear invalidation point just beyond the twin peaks or troughs for setting a stop-loss.
Research Stocks Smarter with Dhanarthi AI Screener
Analyze 5,000+ NSE & BSE stocks with 150+ custom filters, real-time volume breakout scans, and transparent fundamental data.
Use Dhanarthi Screener
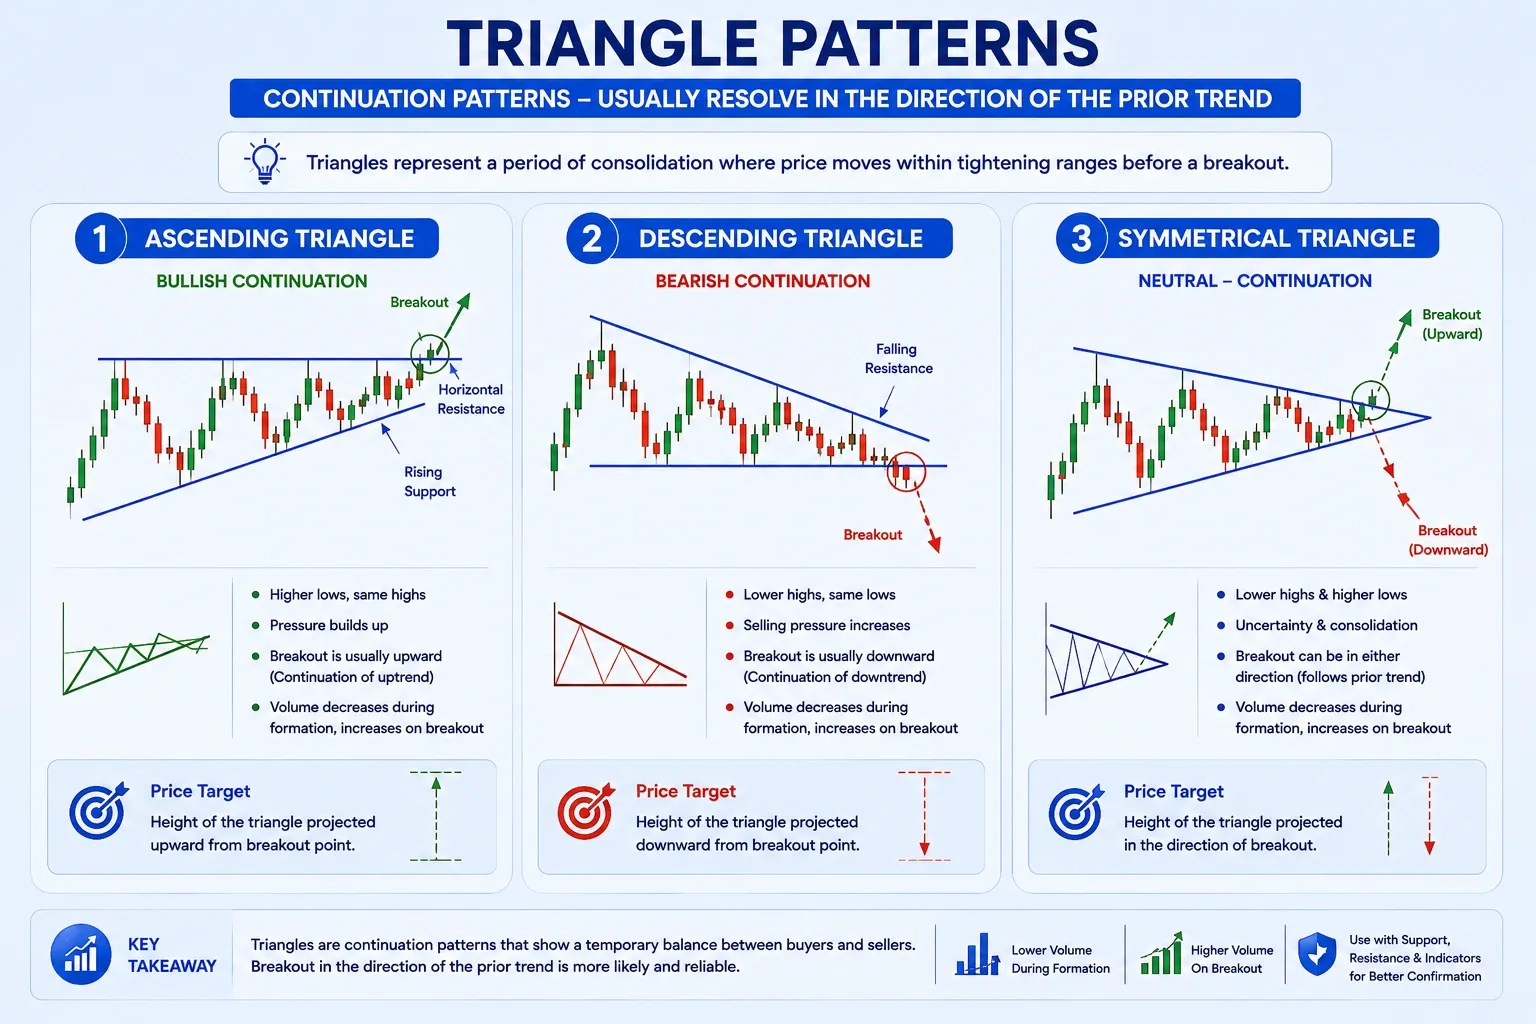
Triangles are continuation patterns that typically form during a pause in the prevailing trend, usually lasting a few weeks to a few months before resolving with a breakout.
| Triangle Type | Structure | Typical Breakout Direction |
|---|---|---|
| Ascending | Flat resistance on top, rising support below | Usually bullish, upward breakout |
| Descending | Flat support on bottom, falling resistance above | Usually bearish, downward breakout |
| Symmetrical | Converging trendlines, both slope toward each other | Breaks in direction of the prior trend |
Target calculation: Measure the height of the triangle at its widest point and project this distance from the breakout point.
Triangles reflect a temporary balance between buyers and sellers before one side gains control. An ascending triangle, for instance, shows buyers repeatedly pushing price to the same resistance level while sellers accept progressively higher lows, a sign that buying pressure is building even before the actual breakout occurs.
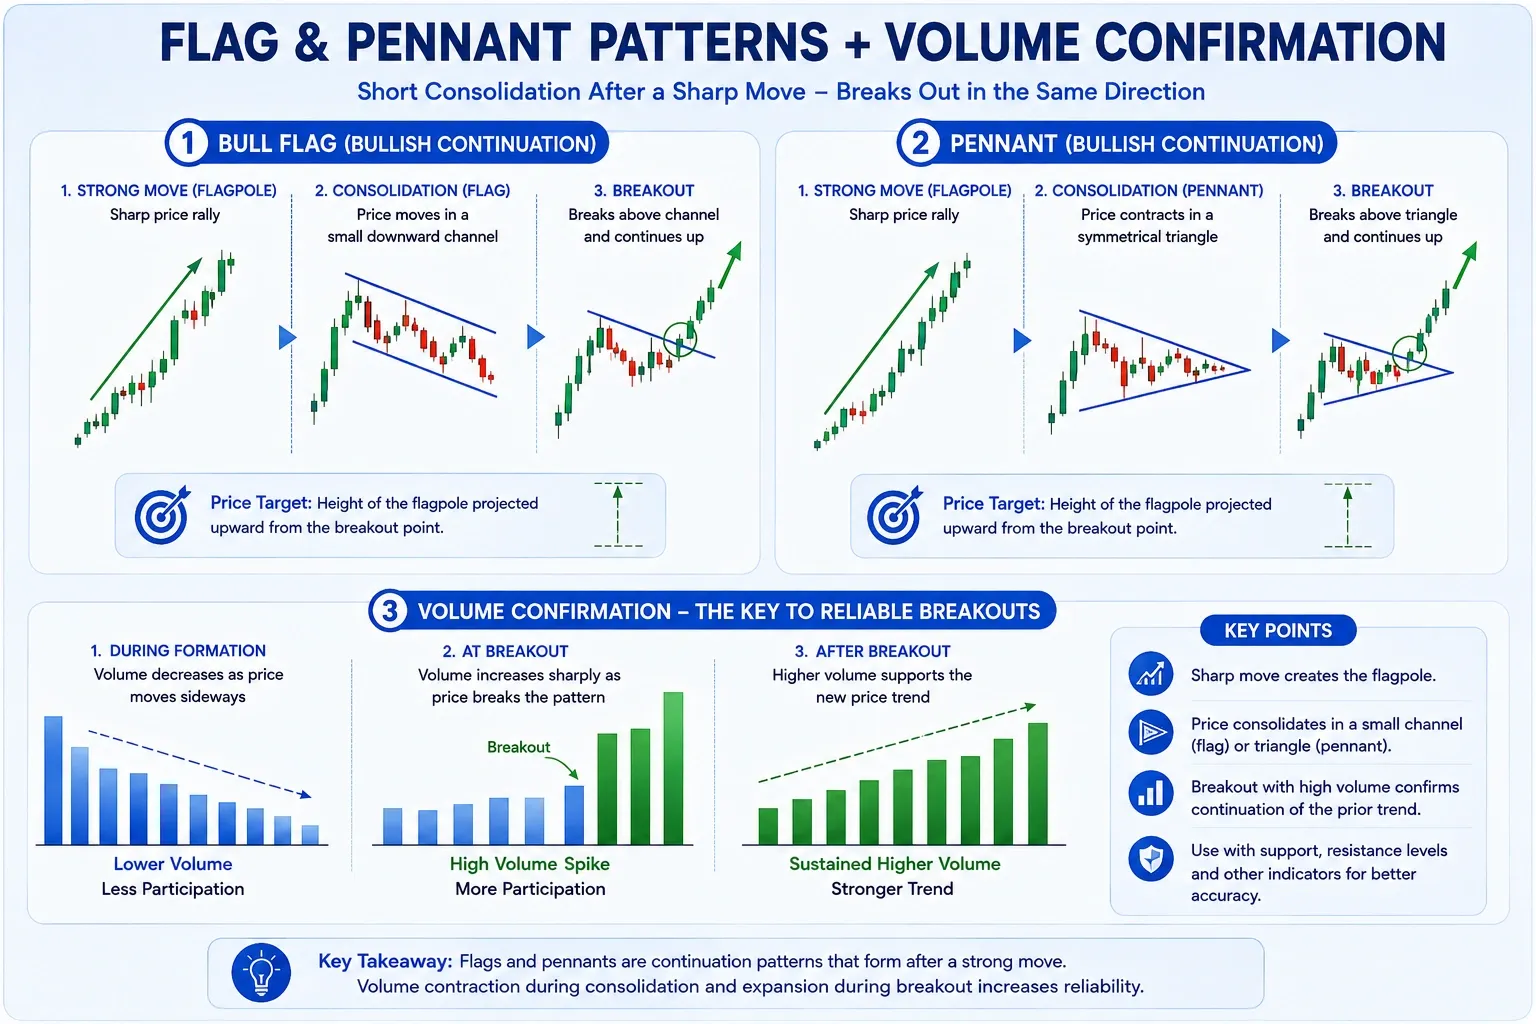
Flags and pennants are short-term continuation patterns that form after a sharp price move, known as the flagpole, followed by a brief consolidation before the trend resumes.
A flag consolidates within a small parallel channel that slopes counter to the prevailing trend, downward in an uptrend, upward in a downtrend. A pennant looks like a small symmetrical triangle instead of a parallel channel, but forms under the same conditions.
Target calculation: Add the height of the flagpole to the breakout point of the flag or pennant.
During Infosys's 2023 rally, the stock formed multiple small flag patterns along the way, with each breakout offering additional entry points as the broader uptrend continued (Source: NSE historical price data). This is a common pattern in momentum-driven Indian large-cap and IT stocks, where sharp rallies are frequently interrupted by brief flag-like pauses rather than full reversals.
Volume is the single most important confirmation tool across every chart pattern discussed above, and it follows a consistent rule regardless of which pattern is forming.
During the consolidation phase of a pattern, whether it is the right shoulder of a head and shoulders, the middle trough of a double top, or the narrowing range inside a triangle, volume typically decreases as trading interest cools. On the actual breakout, whether above a neckline, resistance level, or trendline, volume should increase noticeably to confirm genuine participation behind the move.
A breakout on thin volume is considered far less reliable and more likely to fail or reverse quickly. Many experienced Indian traders treat a breakout without a matching volume spike as a warning sign rather than a confirmed signal, and either wait for a retest of the breakout level or skip the trade entirely.
Recognizing chart patterns accurately is a skill that develops with consistent practice, not something that clicks after reading one article. Most dedicated traders begin identifying patterns with reasonable accuracy within roughly three to six months of regular chart study. Trading them profitably, knowing which setups to act on, which to skip, and how to manage risk once in the trade, typically takes closer to one to two years of live market experience.
This is a realistic expectation worth stating plainly. Chart patterns fail sometimes. A head and shoulders neckline break does not always lead to the expected decline, and a triangle can break in the opposite direction from what the prior trend suggested. This is normal and precisely why a stop-loss should accompany every pattern-based trade, since the value of these patterns comes from favorable risk-to-reward setups over many trades, not from any single pattern being guaranteed to work.
| Pattern | Type | Typical Signal |
|---|---|---|
| Head and Shoulders | Reversal | Bearish |
| Inverse Head and Shoulders | Reversal | Bullish |
| Double Top | Reversal | Bearish |
| Double Bottom | Reversal | Bullish |
| Ascending Triangle | Continuation | Usually Bullish |
| Descending Triangle | Continuation | Usually Bearish |
| Symmetrical Triangle | Continuation | Direction of prior trend |
| Bull Flag/Pennant | Continuation | Bullish |
| Bear Flag/Pennant | Continuation | Bearish |
Data sourced from standard technical analysis references and NSE historical price behavior. Last updated: August 2026.
Chart patterns are not flawless. Common limitations include:
A common mistake among beginner Indian traders is spotting a rough resemblance to a pattern and trading it immediately without waiting for actual confirmation, a closed candle beyond the neckline, resistance, or trendline, along with a volume increase. Acting on an unconfirmed pattern significantly raises the chance of a false signal.
Chart patterns work better as part of a broader technical framework, combined with support and resistance levels and candlestick patterns for entry timing, rather than relied on in isolation. For a broader view of how chart pattern recognition fits into overall technical analysis, understanding indicators alongside price structure gives a fuller picture than patterns alone.

Confused about chart patterns & stock analysis?
Use
Dhanarthi Stock Guru
to chat, analyze price patterns, and ask questions directly.
Chart patterns give traders a visual shorthand for reading the ongoing tug-of-war between buyers and sellers on a price chart. Head and shoulders and double top/bottom patterns signal potential reversals, while triangles, flags, and pennants typically signal a pause before the existing trend resumes. Each pattern comes with a measurable price target, but none of them work reliably without volume confirmation and a clear stop-loss, since even well-formed patterns fail often enough that risk management, not prediction, is what separates consistent traders from the rest.
Disclaimer: This article is for educational purposes only. It does not constitute investment advice. Please consult a SEBI-registered financial advisor before making investment decisions.
1. What are chart patterns in stock market?
Chart patterns are recurring price formations on a stock chart, such as head and shoulders, double tops, and triangles, that reflect shifts in buying and selling pressure and help traders anticipate potential trend reversals or continuations.
2. What is the head and shoulders pattern?
The head and shoulders pattern is a bearish reversal pattern made of three peaks, a higher middle peak called the head flanked by two lower peaks called shoulders, with a neckline connecting the troughs between them. A break below the neckline confirms the pattern.
3. What is a double top and double bottom pattern?
A double top forms after an uptrend when price fails to break a resistance level twice, resembling the letter M, and confirms when price breaks below the middle trough. A double bottom is the bullish mirror image, resembling the letter W.
4. How do triangle patterns work in trading?
Triangle patterns, ascending, descending, and symmetrical, are continuation patterns that form during a pause in the trend and typically resolve with a breakout, usually in the direction of the prior trend for symmetrical triangles.
5. What is a flag pattern in stock trading?
A flag pattern forms after a sharp price move, called the flagpole, followed by a brief consolidation in a small channel that slopes against the prevailing trend. A breakout from the flag usually continues in the original trend direction.
6. How do I calculate the target for a chart pattern?
Most chart pattern targets are calculated by measuring the height of the pattern itself, from peak to trough or the flagpole length, and projecting that distance from the breakout point in the direction of the move.
7. Why is volume important when trading chart patterns?
Volume confirms whether a pattern breakout has genuine participation behind it. Volume typically decreases during pattern consolidation and should increase on the actual breakout, since low-volume breakouts are more likely to fail.
8. How long does it take to learn to read chart patterns?
Most traders start recognizing chart patterns with reasonable accuracy within three to six months of consistent practice, though trading them profitably with proper risk management typically takes one to two years of live market experience.
9. Are chart patterns reliable for intraday trading in India?
Chart patterns can be used for intraday trading, but patterns formed on daily or weekly charts are generally considered more reliable than those on very short intraday timeframes, since they reflect broader market participation.
10. What is the difference between reversal and continuation patterns?
Reversal patterns, like head and shoulders and double tops/bottoms, signal a potential end to the current trend. Continuation patterns, like triangles, flags, and pennants, signal a pause before the existing trend is likely to resume.
11. Can chart patterns fail?
Yes, chart patterns fail regularly even when they appear well-formed. This is why a stop-loss should accompany every pattern-based trade, since the value of chart pattern trading comes from favorable risk-to-reward setups over many trades rather than any single guaranteed outcome.
12. Should chart patterns be combined with other technical tools?
Yes, chart patterns work better when combined with support and resistance levels, candlestick patterns, and volume analysis for confirmation, rather than being used as a standalone trading signal.
Share Market
IPO
Artificial Intelligence
Semi Conductor