




Nifty Sectoral Indices Guide: Bank, IT, Pharma & More
October 16, 2026



TABLE OF CONTENTS
Get AI Summary






Nifty sectoral indices are rule-based baskets that track the largest and most liquid stocks from one industry on the National Stock Exchange. NSE Indices Limited maintains 34 such indices as of June 2026, covering banking, information technology, pharmaceuticals, metals, capital goods, financial services and several emerging areas. Investors use them to monitor which parts of the market are leading or lagging and to gain sector exposure through index funds and ETFs without selecting individual companies.
Investors who follow the broad sectors page on Dhanarthi can see how these indices fit into the overall market structure. A sectoral index does not cover every listed company in that industry. It holds a fixed number of the biggest free-float market-capitalisation stocks that meet liquidity rules. The movement of the index therefore reflects the performance of those selected large companies, not the entire sector.
A sectoral index is a stock market index limited to companies from one industry. NSE Indices Limited, the index subsidiary of the National Stock Exchange, builds and maintains the Nifty family of indices. Broad indices such as the Nifty 50 cover companies across the economy. Sectoral indices narrow the basket so that the index level shows how a particular industry group is performing.
As of June 2026, NSE Indices maintains 34 sectoral indices. In that month it launched 11 new ones: Nifty Power, Nifty Capital Goods, Nifty Telecommunications, Nifty Construction, Nifty Consumer Services, Nifty Commercial & Transport Services, Nifty Retail, Nifty Hospitals, Nifty NBFC, Nifty Housing Finance and Nifty Insurance. The expansion gave investors more granular benchmarks for passive products and sector tracking.
These indices follow published methodologies. Each has a fixed number of constituents, eligibility rules, free-float market-capitalisation weighting and semi-annual reviews. The headline level is a price-return index. NSE also publishes a total-return version that adds dividends, which is the version most funds use as a benchmark.
Research Stocks Smarter with Dhanarthi AI Screener
Analyze 5,000+ NSE & BSE stocks with 150+ custom filters, real-time volume breakout scans, and transparent fundamental data.
Use Dhanarthi Screener
NSE follows a consistent process for most sectoral indices. A company must be part of the Nifty 500 (or the top 800 by turnover and market capitalisation if fewer eligible stocks exist). It must belong to the relevant sector based on its primary business. The stock must have traded on at least 90 percent of trading days in the previous six months and must have been listed for at least one month.
From the eligible stocks, NSE selects the largest by free-float market capitalisation until the index reaches its fixed size. Preference goes to stocks available in the futures and options segment. Reviews occur semi-annually with cut-off dates of 31 January and 31 July. Changes take effect after four weeks’ notice.
Weights use free-float market capitalisation. Free float excludes shares held by promoters, including the government. Caps limit concentration. For Nifty IT and Nifty Pharma, no single stock may exceed 33 percent and the top three may not exceed 62 percent at rebalancing. Nifty Bank, because it has active derivatives, follows tighter SEBI rules: at least 14 stocks, largest stock not above 20 percent, top three not above 45 percent. These limits were phased in between December 2025 and March 2026.
Between reviews, weights drift with price changes. A strong rise in the largest stock can temporarily push its weight above the cap until the next rebalance.
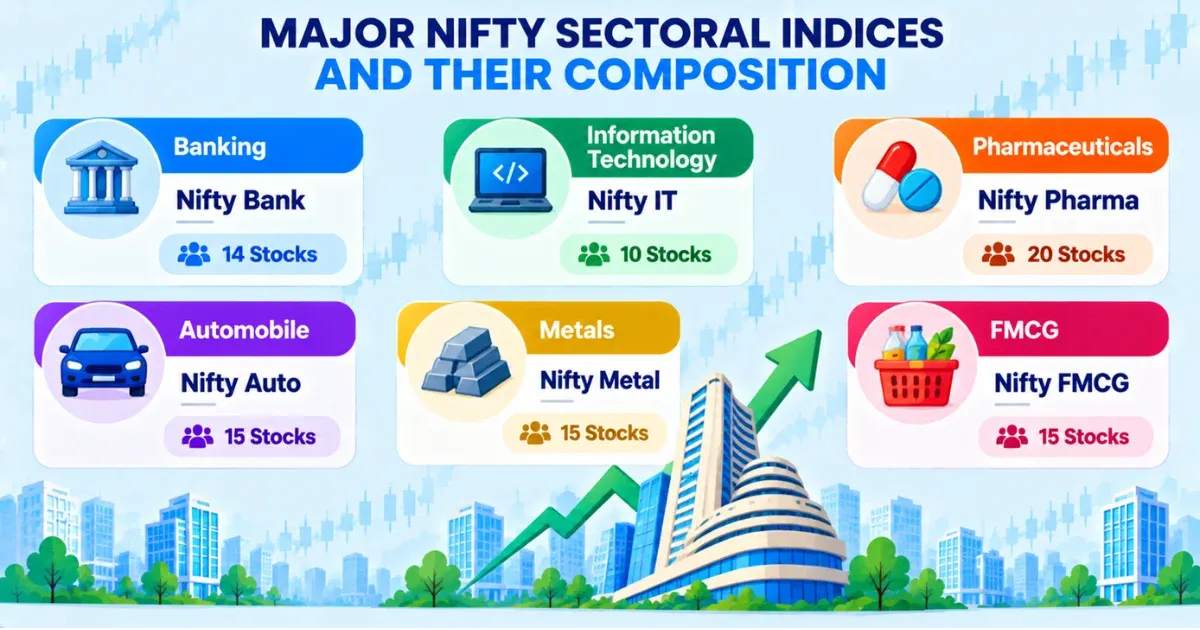
The most widely followed indices have these fixed sizes based on NSE factsheets as of August 2026:
Nifty Bank holds 14 stocks of large private and public-sector banks.
Nifty IT holds 10 stocks of IT services and software companies.
Nifty Pharma holds 20 stocks of pharmaceutical companies.
Nifty Auto holds 15 stocks.
Nifty FMCG holds 15 stocks.
Nifty Financial Services holds 20 stocks covering banks, NBFCs and insurers.
Nifty Metal holds 15 stocks.
Nifty Realty holds 10 stocks.
HDFC Bank is typically the largest weight in Nifty Bank. As of August 2026 its weight was about 17 percent. ICICI Bank and State Bank of India follow. The top three together stood near 42 percent.
In Nifty IT, Infosys carried about 29 percent and the top three (Infosys, TCS and HCL Technologies) reached about 61 percent. Sun Pharmaceutical Industries led Nifty Pharma at about 21 percent.
Nifty Bank excludes NBFCs and insurers. Those sit in Nifty Financial Services or the newer Nifty NBFC and Nifty Insurance indices. Nifty Pharma excludes hospital chains; those appear in Nifty Healthcare or the new Nifty Hospitals index. Nifty Capital Goods, launched in June 2026, tracks industrial and engineering companies. Readers can compare that sector’s stocks on the capital goods stocks page.
Sector performance has diverged sharply in 2026. Data as of the close on 15 October 2026 show clear leaders and laggards.
| Index | 1-Day (15 Oct 2026) | 1-Month | 3-Month | 1-Year | Approx. Number of Stocks |
|---|---|---|---|---|---|
| Nifty Metal | +0.10% | -5.14% | -4.13% | +18.57% | 15 |
| Nifty Pharma | +0.31% | -1.42% | -0.71% | +17.8% to +18.9% | 20 |
| Nifty Healthcare | +0.39% | -3.53% | -4.75% | +8.9% | 20 |
| Nifty Bank | +0.89% | +0.03% | -3.37% | -0.4% to -1.7% | 14 |
| Nifty Auto | +1.67% | -4.41% | -4.01% | -3.6% | 15 |
| Nifty IT | +1.82% | +3.94% | +7.67% | -12.8% to -13.2% | 10 |
| Nifty FMCG | -1.06% | -0.09% | -7.24% | -17.8% | 15 |
| Nifty Financial Services | +1.67% | +1.15% | -4.98% | -4.9% | 20 |
Data sourced from NSE / market data aggregators. Last updated: October 2026.
Nifty Metal and Nifty Pharma led one-year returns. Metal stocks benefited from recovery in ferrous and non-ferrous prices. Pharma gained from defensive earnings and export demand. Nifty IT lagged on concerns over global technology spending and AI-related disruption. Nifty FMCG also underperformed. On 15 October 2026 the Nifty 50 closed at 22,997.35, up 1.66 percent, with banking and IT stocks contributing to the day’s gain.
Over longer periods, historical data from NSE show metals and energy delivering strong 10-year compounded returns in some studies, while IT’s decade-long leadership was interrupted by the 2026 decline.
Investors track these indices for three main purposes.
First, they provide a quick reading of market rotation. When Nifty Metal rises while Nifty IT falls, capital is moving between cyclical and growth sectors. Checking the number of advancing versus declining constituents gives a clearer picture than the headline alone. In one example, if the two largest IT stocks fall 6 percent while the other eight rise 4 percent, the index can still decline even though most stocks advanced.
Second, they serve as benchmarks. Actively managed sectoral mutual funds must invest at least 80 percent of assets in their chosen sector under SEBI rules. They report performance against the total-return version of the relevant Nifty index.
Third, they underpin passive products. Index funds and ETFs hold the same stocks in the same weights. Nifty Bank has the most liquid futures and options market among sectoral indices. Newer indices such as Nifty Capital Goods and Nifty NBFC are expected to attract passive products over time.
Readers interested in financial services exposure can review the financial services stocks page, which covers banks, NBFCs and related companies that appear across several Nifty indices.
Sectoral indices concentrate risk. A regulatory change, a global demand slowdown or a setback at one large company can move the entire index. Nifty IT’s high concentration (top three near 61 percent) means Infosys and TCS heavily influence the level. Nifty Bank’s free-float weighting reduces the impact of high government ownership in public-sector banks relative to their total market capitalisation.
The indices do not represent the full sector. Mid-sized and small companies are excluded. A rally confined to smaller pharma companies may not appear in Nifty Pharma. Related businesses sit in other indices, so an investor who wants pure banking exposure must distinguish Nifty Bank from Nifty Financial Services.
Weights drift between semi-annual reviews. Caps apply only at rebalancing. The headline index is price return; total-return versions include dividends and are the appropriate benchmarks for funds.
Past market cycles show sharp sector rotation. During the 2020 pandemic, pharma and IT rose strongly while banking and energy fell. In 2026, metals and pharma led while IT and FMCG lagged. Investors who chase the recent leader without checking concentration and valuation can face large drawdowns when the cycle turns.
The Nifty 50 is a diversified basket of 50 large companies across sectors. Sectoral indices are narrower. On 15 October 2026, financial services stocks (largely banks) contributed the most to the Nifty 50’s 374-point gain, followed by energy and technology. Sectoral indices let investors isolate those contributions.
Broad indices reduce single-sector risk. Sectoral indices increase it in exchange for targeted exposure. An investor who expects metal prices to recover can use a Nifty Metal ETF. An investor who wants broad equity exposure uses a Nifty 50 or Nifty 500 product. Combining both approaches requires understanding the overlap: many large banks appear in both Nifty Bank and the Nifty 50.
Free-float weighting and concentration caps apply to both, but sectoral indices are inherently more concentrated because the universe is smaller. Checking the latest NSE factsheet for current weights remains the practical step before investing.
Start with the official NSE Indices website or factsheets for the latest constituents and weights. Note the review dates and any upcoming changes. Compare one-year, three-year and five-year returns across indices to see relative strength. Examine valuation metrics such as median price-to-earnings ratios for the sector.
For individual stock research within a sector, use company filings on BSE or NSE and tools that screen for fundamentals. Confirm whether a stock is in the index and its current weight. For passive exposure, verify that the ETF or index fund tracks the total-return version and check expense ratios and tracking error.
Monitor macroeconomic drivers relevant to the sector: commodity prices for metals and energy, global IT spending and currency for technology, domestic credit growth and interest rates for banks, and regulatory developments for pharmaceuticals. Sectoral indices simplify tracking but do not replace company-level analysis.

Confused about chart patterns & stock analysis?
Use
Dhanarthi Stock Guru
to chat, analyze price patterns, and ask questions directly.
Nifty sectoral indices give Indian investors a clear, rule-based way to track industry performance and access sector exposure through passive products. With 34 indices as of June 2026, coverage now includes both established areas such as banking and IT and newer ones such as capital goods, retail, hospitals and insurance. The indices are useful but limited: they measure selected large stocks, not every company in the sector, and they carry concentration risk.
Investors who understand the construction rules, free-float weighting, concentration caps and the difference between price-return and total-return versions can use the data more effectively. Checking official factsheets and combining sector views with broader market analysis remains the practical approach.
This article is for educational purposes only. It does not constitute investment advice. Please consult a SEBI-registered financial advisor before making investment decisions.
1. How many Nifty sectoral indices does NSE maintain?
NSE Indices Limited maintains 34 sectoral indices as of June 2026. The number increased after the launch of 11 new indices covering power, capital goods, telecommunications, construction, retail, hospitals, NBFCs, housing finance and insurance.
2. How many stocks are in Nifty Bank, Nifty IT and Nifty Pharma?
According to NSE factsheets as of August 2026, Nifty Bank has 14 stocks, Nifty IT has 10 stocks and Nifty Pharma has 20 stocks. The numbers are fixed by each index methodology and cover only the largest eligible companies.
3. Does Nifty Bank include NBFCs and insurance companies?
No. Nifty Bank includes only banks. NBFCs appear in Nifty Financial Services or the newer Nifty NBFC index. Insurance companies appear in Nifty Financial Services or Nifty Insurance.
4. Why do sectoral index weights differ from total market capitalisation?
NSE weights the indices by free-float market capitalisation, which excludes promoter and government holdings. Concentration caps also apply at each rebalance. A company with high promoter ownership therefore carries a lower weight than its total market value suggests.
5. Can I invest directly in a Nifty sectoral index?
You cannot buy the index itself. You can invest through index funds or ETFs that track the index, or by buying the constituent stocks in similar weights. Most funds use the total-return version of the index as their benchmark.
NSE Indices Press Release, 15 June 2026: Launch of 11 New Sectoral Indices – Announcement that total sectoral indices reached 34.
NSE Indices Methodology Document – Eligibility, weighting and review rules for sectoral indices.
Nirmal Bang Knowledge Center: Nifty Bank, Nifty IT & Nifty Pharma – Composition details and weights as of August 2026 factsheets.
Market data aggregators and NSE closing prices as of 15 October 2026 for index levels and returns.
Company market data referenced from NSE and BSE sources for illustrative weights.
Share Market
IPO
Artificial Intelligence
Semi Conductor