


What Is ROCE? Meaning, Formula and Examples
October 2, 2026



TABLE OF CONTENTS
Get AI Summary





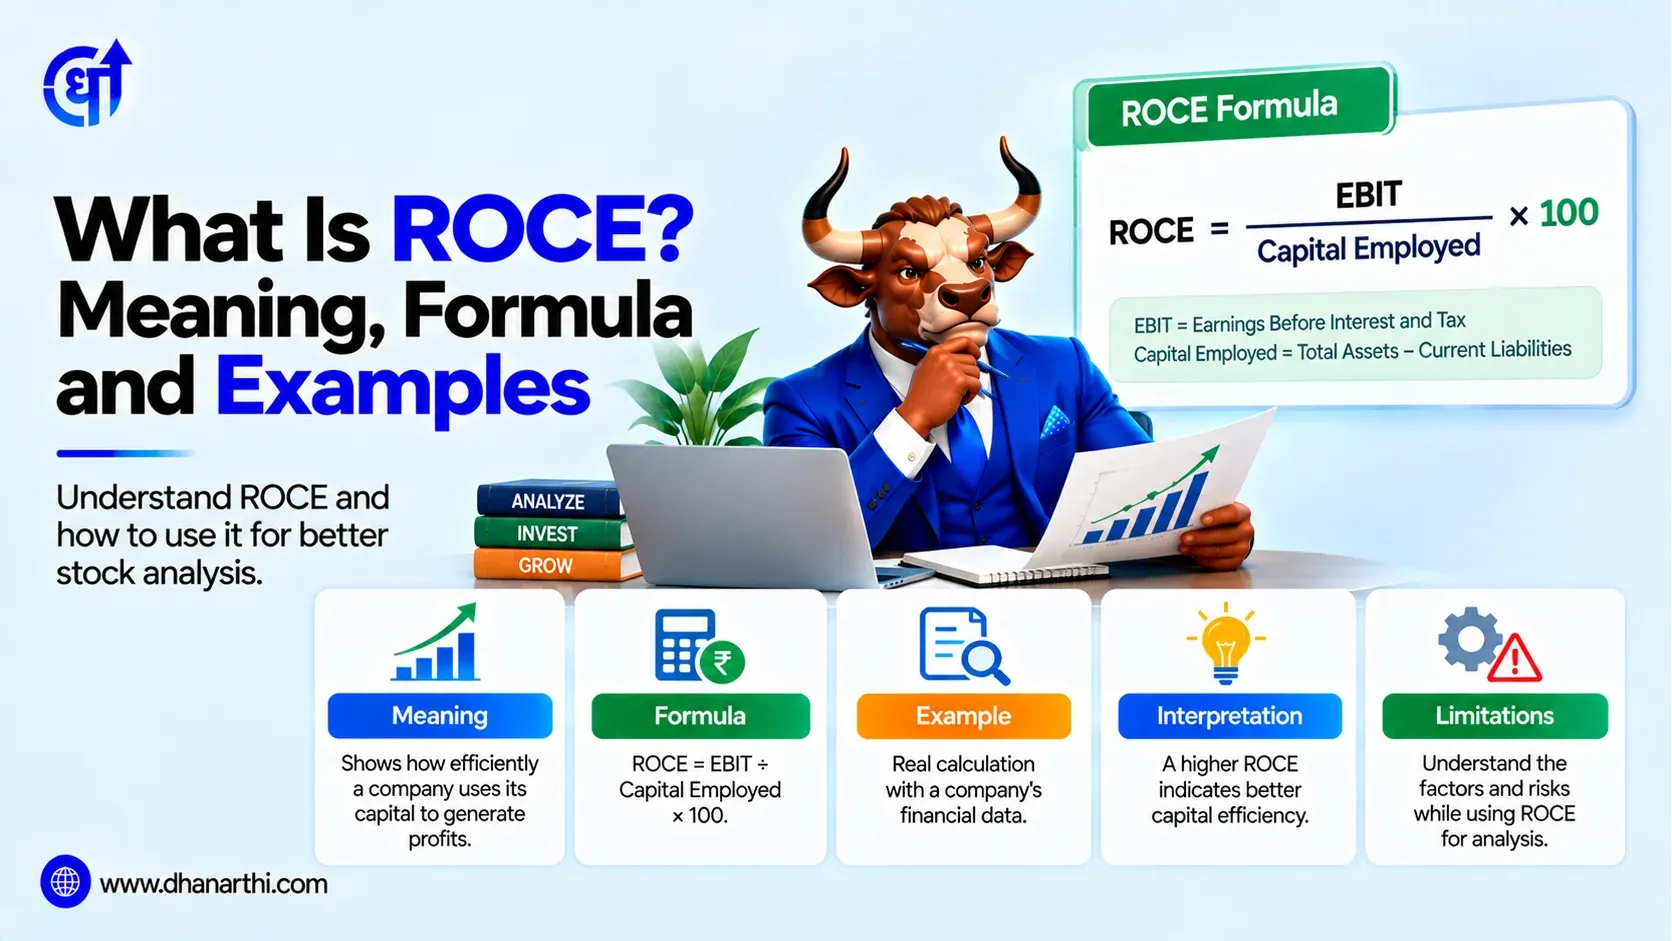
ROCE (Return on Capital Employed) is a financial ratio that measures how efficiently a company generates operating profit from the total capital, both debt and equity, invested in its business. It is calculated as EBIT divided by Capital Employed, and is one of the metrics covered in a broader fundamental analysis of a company's quality and capital efficiency.
ROCE, or Return on Capital Employed, measures how much operating profit a company generates for every rupee of capital, debt and equity combined, that it has deployed in the business. It answers a specific question: is management using the total capital at its disposal efficiently to produce returns, regardless of whether that capital came from shareholders or lenders?
This makes ROCE a genuinely useful complement to other return ratios like ROE, since it doesn't get skewed by how a company chooses to finance itself. A company that uses a lot of debt can show an inflated ROE simply through leverage, while ROCE looks at the return generated on the full capital base, debt included, giving a more complete picture of underlying business efficiency.
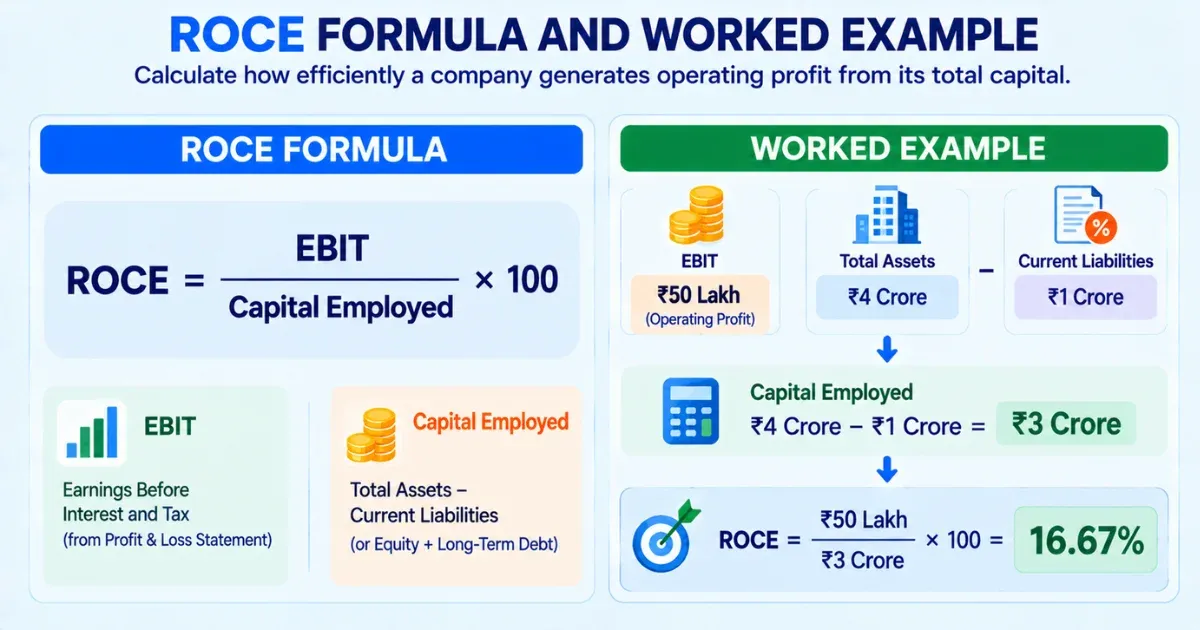
ROCE = EBIT / Capital Employed x 100
Where EBIT is Earnings Before Interest and Tax, found on a company's profit and loss statement, and Capital Employed is calculated as:
Capital Employed = Total Assets - Current Liabilities
(This is mathematically equivalent to Equity + Long-Term Debt, since total assets minus current liabilities isolates the capital actually funding long-term operations.)
Worked example: A company reports EBIT of Rs 50 lakh for the year. Its total assets stand at Rs 4 crore, and current liabilities are Rs 1 crore. Capital Employed = Rs 4 crore - Rs 1 crore = Rs 3 crore. ROCE = (Rs 50 lakh / Rs 3 crore) x 100 = 16.67%. This means the company generated roughly Rs 16.67 in operating profit for every Rs 100 of capital employed in the business.
This is a detail that trips up a lot of comparisons between data sources, and it's worth understanding with a real example rather than in the abstract. Asian Paints' own FY26 annual report states a Return on Capital Employed of 28.9%, up from 28.4% in FY25. Around the same period, a broker research report on the same company calculated RoCE at a much lower 15.2% for FY25.
Both numbers are "correct" by their own internal definition, the gap comes from differences in exactly what's included in capital employed, whether cash and investments are excluded, whether the calculation uses standalone or consolidated financials, and how EBIT itself is adjusted for one-off items. This is precisely why ROCE should never be compared across two different sources without first checking that both are using a consistent definition, comparing a company's own ROCE over time from a single consistent source is far more reliable than comparing one source's number for Company A against a different source's number for Company B.
Research Stocks Smarter with Dhanarthi AI Screener
Analyze 5,000+ NSE & BSE stocks with 150+ custom filters, real-time volume breakout scans, and transparent fundamental data.
Use Dhanarthi Screener
There's no single universal threshold, since what counts as "good" varies meaningfully by sector and by the capital intensity of the business. That said, a commonly used rule of thumb treats a ROCE consistently above 15-20% as strong, and a ROCE below a company's own cost of capital as a warning sign, since in that case the business is effectively earning less than it costs to fund its own operations.
Capital-light businesses like consumer brands and software companies tend to run structurally higher ROCE than capital-intensive businesses like infrastructure, steel, or power, where large upfront asset investment is unavoidable. Comparing ROCE within the same sector, rather than across very different business models, gives a far more meaningful read on relative efficiency.
| Factor | ROCE | ROE |
|---|---|---|
| Formula | EBIT / Capital Employed | Net Income / Shareholders' Equity |
| Capital considered | Both debt and equity | Only shareholders' equity |
| Affected by leverage | Less sensitive to debt levels | Can be inflated by higher debt |
| Best used for | Comparing capital efficiency across different capital structures | Measuring return specifically to equity shareholders |
A deeper comparison of these two metrics, including when each one tells a more complete story, is covered in our dedicated guide to ROE vs ROCE. As a general practice, checking both together, rather than relying on either one alone, gives a fuller picture than either ratio provides in isolation.
This is a limitation that's frequently glossed over. ROCE is built around EBIT, treating interest as a financing cost that sits outside a company's core operating profit. For a bank or NBFC, this breaks down entirely, interest is not a financing cost to be excluded, it is the core business input and output, the very thing the company exists to manage. Applying the standard ROCE formula to a bank produces a number that doesn't meaningfully reflect what investors actually care about for that sector.
For financial companies, metrics like Net Interest Margin (NIM), Return on Assets (ROA), and Return on Equity (ROE) are generally considered more appropriate measures of efficiency and profitability than ROCE, which is best reserved for non-financial, operating businesses where separating interest from operating profit makes analytical sense.
A single year's ROCE, even when calculated consistently, tells you relatively little on its own. What matters more is the trend over several years, is capital efficiency improving, holding steady, or deteriorating as the business grows? Asian Paints' own historical ROCE illustrates this well: the company's ROCE ran as high as 42% in 2015, gradually moderated through the high-20s and low-30s over the following decade as competition intensified and the business matured, and settled around 26-29% more recently depending on the source's calculation method.
This moderating trend doesn't necessarily signal a weakening business, mature, market-leading companies often see ROCE settle at a lower, more sustainable level as rapid early growth tapers off. What would be more concerning is a sharp, unexplained drop in a single year, or a multi-year declining trend without a clear reason tied to increased investment for future growth.

Confused about chart patterns & stock analysis?
Use
Dhanarthi Stock Guru
to chat, analyze price patterns, and ask questions directly.
ROCE measures how efficiently a company turns its total capital, both debt and equity, into operating profit, making it a genuinely useful complement to ROE for judging capital efficiency independent of financing choices. The real value of ROCE comes from tracking it consistently over several years from a single source, checking it against sector peers rather than unrelated industries, and understanding where it simply doesn't apply, as with banks and NBFCs, rather than treating any single year's number as a definitive verdict on a company's quality. For a broader view of how ROCE fits alongside other financial ratios used in fundamental analysis, comparing several metrics together remains more reliable than relying on any one in isolation.
Disclaimer: This article is for educational purposes only. It does not constitute investment advice. Please consult a SEBI-registered financial advisor before making investment decisions.
1. What is ROCE in simple terms?
ROCE, or Return on Capital Employed, measures how efficiently a company generates operating profit from the total capital, both debt and equity, it has invested in its business.
2. What is the formula for ROCE?
ROCE is calculated as EBIT (Earnings Before Interest and Tax) divided by Capital Employed, multiplied by 100 to express it as a percentage.
3. How is Capital Employed calculated?
Capital Employed is generally calculated as Total Assets minus Current Liabilities, which is mathematically equivalent to Equity plus Long-Term Debt.
4. What is a good ROCE for a company?
There's no universal benchmark, but a ROCE consistently above 15-20% is often considered strong, while a ROCE below the company's own cost of capital is generally a warning sign.
5. What is the difference between ROCE and ROE?
ROCE considers both debt and equity in the capital base, while ROE only considers shareholders' equity, making ROCE less sensitive to how a company is financed and better suited for comparing capital structures.
6. Why do different sources show different ROCE for the same company?
ROCE figures can differ between sources due to variations in how capital employed is defined, whether cash and investments are excluded, and whether standalone or consolidated financials are used.
7. Why doesn't ROCE work well for banks and NBFCs?
ROCE is built on EBIT, treating interest as a financing cost outside operating profit, but for banks and NBFCs, interest is the core business itself, making the standard formula structurally unsuitable for this sector.
8. Should I look at one year's ROCE or a multi-year trend?
A multi-year trend is far more meaningful than a single year's ROCE, since one year's number can be distorted by one-off items and says little about sustained capital efficiency on its own.
9. Can ROCE be negative?
Yes, a negative ROCE indicates the company's EBIT is negative, meaning it is generating an operating loss relative to the capital employed in the business.
10. Is a higher ROCE always better?
Generally yes, but ROCE should be compared within the same sector, since capital-light businesses naturally run structurally higher ROCE than capital-intensive ones, making cross-sector comparisons less meaningful.
11. What is the difference between ROCE and ROIC?
ROCE uses EBIT divided by Capital Employed (Total Assets minus Current Liabilities), while ROIC (Return on Invested Capital) typically uses NOPAT divided by a narrower invested capital base, making the two related but not identical.
12. How often should I check a company's ROCE?
Checking ROCE alongside each annual or quarterly result, and tracking it over at least 3-5 years, gives a more reliable read on trend direction than checking it only once.
Share Market
IPO
Artificial Intelligence
Semi Conductor